. 2013 Spring:2013:341-409.
doi: 10.1353/eca.2013.0001.

Fifty Years of Family Planning: New Evidence on the Long-Run Effects of Increasing Access to Contraception

Affiliations

Fifty Years of Family Planning: New Evidence on the Long-Run Effects of Increasing Access to Contraception

Martha J Bailey. Brookings Pap Econ Act. 2013 Spring.

Abstract

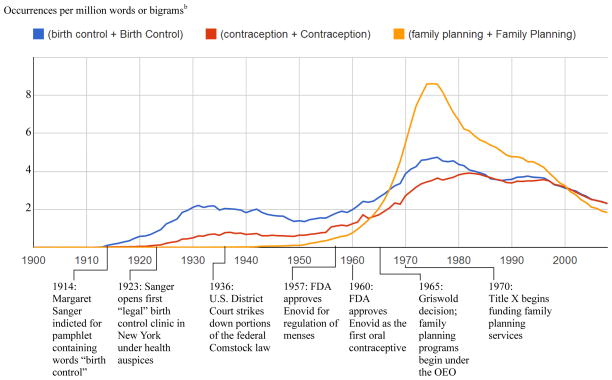
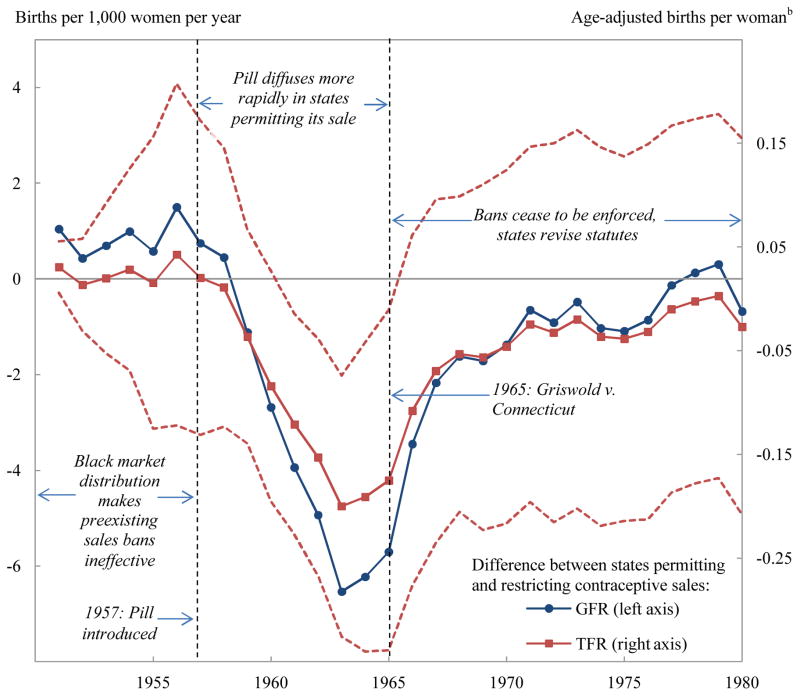
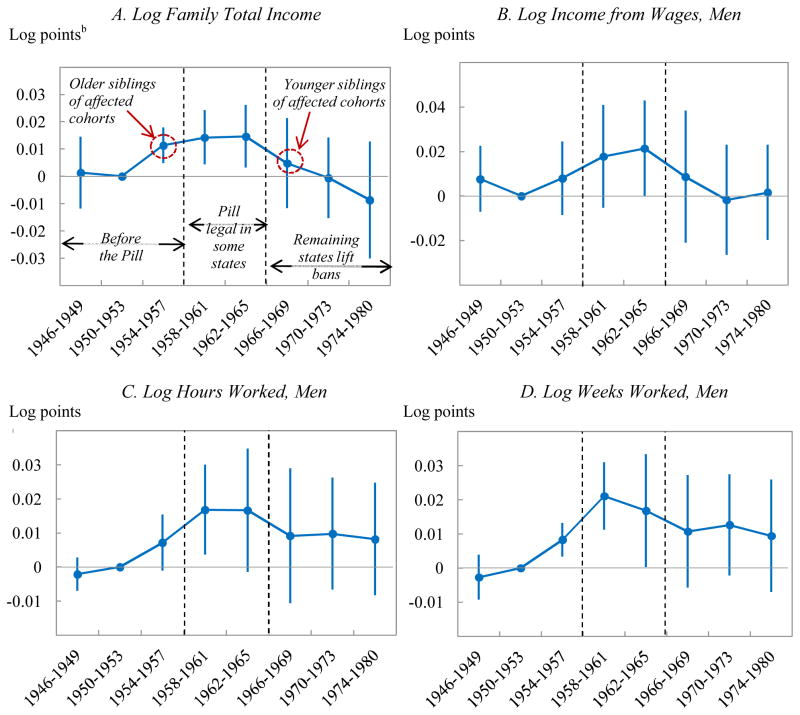
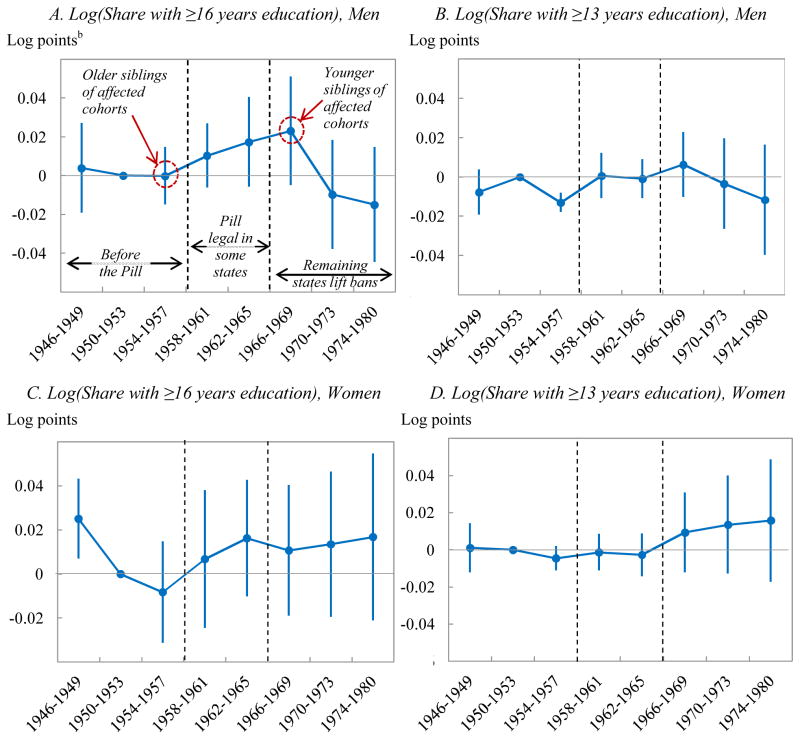
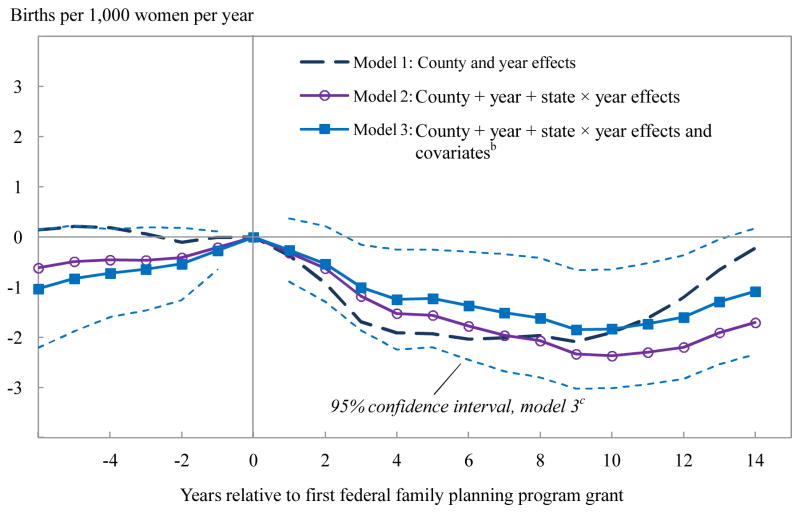
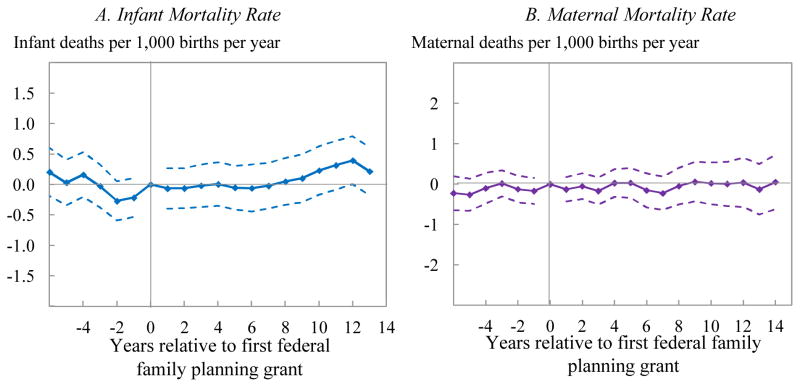
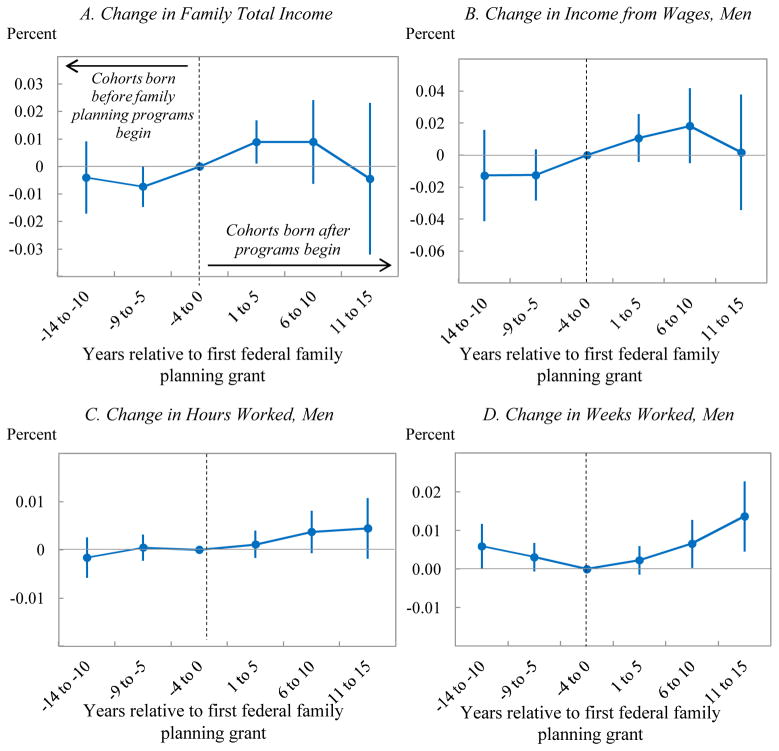
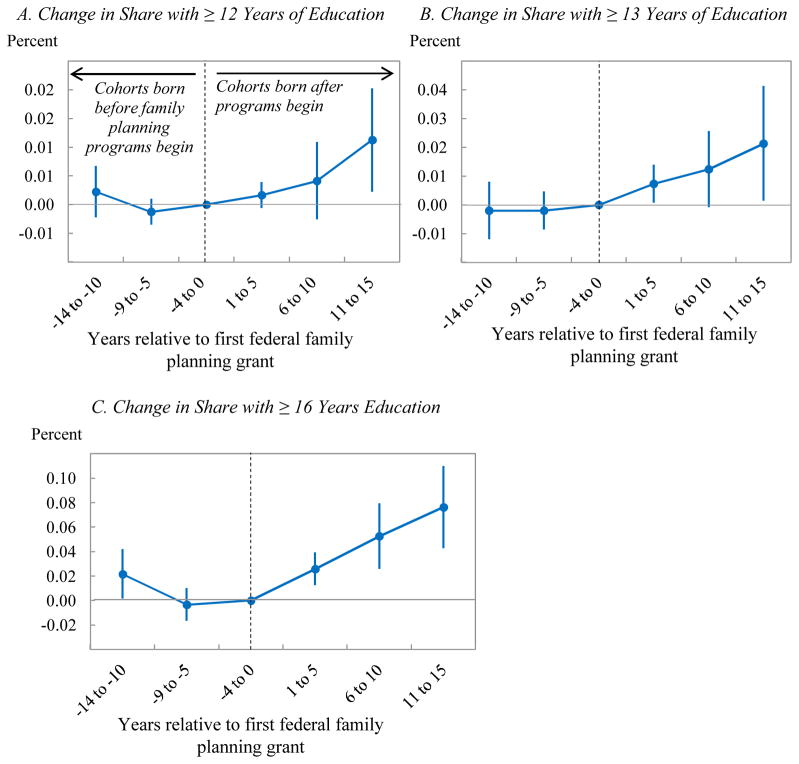
This paper assembles new evidence on some of the longer-term consequences of U.S. family planning policies, defined in this paper as those increasing legal or financial access to modern contraceptives. The analysis leverages two large policy changes that occurred during the 1960s and 1970s: first, the interaction of the birth control pill's introduction with Comstock-era restrictions on the sale of contraceptives and the repeal of these laws after Griswold v. Connecticut in 1965; and second, the expansion of federal funding for local family planning programs from 1964 to 1973. Building on previous research that demonstrates both policies' effects on fertility rates, I find suggestive evidence that individuals' access to contraceptives increased their children's college completion, labor force participation, wages, and family incomes decades later.


Figures

Figure 1
Figure 1. Incidence of Terms Related to Contraception in Google Books, 1900–2008a
Source: Author’s tabulations using http://books.google.com/ngrams a. FDA = Food and Drug Administration; OEO = Office of Economic Opportunity. b. Words when only “contraception is used; bigrams when more than two words are used. A bigram is two consecutive words. Counts include both capitalized and lowercase occurrences.
Figure 2
Figure 2. Survey Responses Regarding Support for the Birth Control Movement and Family Planning Programs, 1936–2012
Source: Author’s tabulations using Roper Center data. See the online appendix for further details on the questions and the surveys.
Figure 3
Figure 3. Federal Spending on Family Planning, 1965–2008a
Sources: Office of Population Affairs budget data from www.hhs.gov/opa/about/budget, accessed February 7, 2009, Sonfield and Gold (2012), and author’s calculations using data from the National Archives Community Action Program and National Archives Federal Outlays Data (Bailey 2012). a. Title X appropriations differ from those in the inflation-adjusted table 14 in Alan Guttmacher Institute (2000), because data in that table are deflated using the CPI for medical care whereas here the CPI-U is used. Title X data for 1969 are unavailable. b. Includes Title X and OEO appropriations.
Figure 4
Figure 4. General Fertility Rates and Completed Childbearing over the Last Century
Sources: National Center for Health statistics, “Live Births, Birth Rates, and Fertility Rates, by Race: United States, 1909–2000,” available at www.cdc.gov/nchs/data/statab/t001x01.pdf, and Bailey, Hershbein, and Guldi (forthcoming) using data from the 1940–90 IPUMS of the decennial censuses and the 1995–2010 June Current Population Surveys. a. Rates are from surveys undertaken in the top horizontal scale. b. Mean lifetime births is the mean self-reported number of children ever born for each birth cohort (bottom horizontal scale), measured between the ages of 41 and 70. Dashed lines are extensions of the series using the June Current Population Surveys for all women aged 41 and over.
Figure 5
Figure 5. Differences-in-Differences Estimates of Fertility Effects of the Pill and the Griswold Decisiona
Source: Author’s calculations using data from the 1950–67 Vital Statistics volumes and NCHS (2003). See the online appendix for details of the data sources and the regressions. a. Each series plots weighted least-squares estimates of τ1 from equation 1 using either the general fertility rate (GFR) or the total fertility rate (TFR) as the dependent variable. Robustness checks are omitted and can be found in Bailey (2010) for the GFR. b. This scale is in TFR units as defined in footnote 22 c. Dashed lines indicate pointwise 95 percent upper and lower confidence intervals for the TFR estimates based on heteroskedasticity robust standard errors corrected for an arbitrary covariance structure within states.
Figure 6
Figure 6. Estimates of the Effects of the Pill and Griswold on Next-Generation Family Income, Wages and Labor-Force Participationa
Source: Author’s calculations using data from the 5 percent sample of the 2000 decennial census and the 2005–11 ACS (Ruggles and others 2010). See the online appendix for details of the data sources and the regressions. a. Estimates are of the effects in adulthood of being born in a state with a ban on contraceptive sales, from the specification of equation 2 described in the text. The 1950–53 birth cohort category is omitted, and error bars represent 90 percent confidence intervals based on heteroskedasticity-robust standard errors corrected for an arbitrary covariance structure within birth state. The sample consists of individuals born in the United States from 1946 to 1980 who are aged 20 to 60. Data are collapsed to birth cohort category × birth state × year of observation cells and weighted by the population of each cell. In the 2000 census, income is measured for calendar 1999. In the ACS, income is measured for the 12 months before the survey. The ACS surveys are conducted throughout the year, and, to protect confidentiality, the month of the survey is not released. Each income observation is inflated to real 2012 dollars using the consumer price index. Income in the ACS is treated as earned entirely in the year before the survey (see usa.ipums.org/usa/acsincadj.shtml). Weeks of work in the previous year are recorded in intervals in the 2008–11 ACS, so interval means are constructed here using the 2000–07 period when individual weeks worked are reported. The cell means used in the estimation include zero hours or weeks worked when applicable. b. Differences in log outcomes between states permitting and states restricting contraceptive sales. Normalized to equal zero in 1950–53.
Figure 7
Figure 7. Estimates of the Effects of the Pill and Griswold on Children’s Higher Educational Attainmenta
Source: Author’s calculations using data from the 5 percent sample of the 2000 decennial census and the 2005–11 ACS. See the online appendix for details of the data sources and the regressions. a. See figure 6 for details of the estimation. b. Differences in log outcomes between states permitting and states restricting contraceptive sales. Normalized to equal zero in 1950–53.
Figure 8
Figure 8. Estimates of the Effects of Subsidizing Family Planning Services on the General Fertility Ratea
Source: Author’s calculations using data from the National Archives, the Office of Economic Opportunity (1969, , and 1974), and hand-entered data by county from Vital Statistics; Natality Detail microdata from NCHS (2003); and Surveillance Epidemiology and End Results (SEER) data (Surveillance Research Program, National Cancer Institute 2009). See the online appendix for details of the data sources and the regressions. (See Bailey 2012.) a. The figure plots weighted least-squares estimates of the change in the difference in general fertility rates between counties with and counties without federal family planning grants relative to time zero (y in equation 2). The weights are the 1970 population of women aged 15 to 44. Denominators for 1959–68 were constructed by linearly interpolating information between the 1950, 1960, and 1970 censuses; denominators for 1969–88 use the SEER data. Dashed lines plot 95 percent, pointwise confidence intervals for model 3 based on heteroskedasticity-robust standard errors that account for an arbitrary covariance structure within county. b. The model adds 1960 county covariates interacted with a linear trend and controls from the REIS data to model 2. See the text for details. c. Pointwise confidence intervals based on heteroskedasticity-robust standard errors that account for an arbitrary covariance structure within county.
Figure 9
Figure 9. Estimates of the Effects of Subsidizing Family Planning Services on Infant and Maternal Mortalitya
Source: Author’s calculations using Multiple Cause of Death microdata, 1959–88, from NCHS (2008) for the numerators, and hand-entered 1959–67 birth records from Vital Statistics and 1968–88 Natality Detail microdata from NCHS (2003) for the denominators. See the online appendix for details of the data sources and the regressions. a. Effects are measured as changes in the differences in the indicated outcome between areas receiving and areas not receiving federal family planning grants, relative to time zero. Dashed lines indicate pointwise 95 percent confidence intervals. Estimates are for model 3; see the text and notes to figure 8 for more details on the estimation; see the online appendix for details of the data sources and regression output.
Figure 10
Figure 10. Estimates of the Effects of Family Planning Programs on Next-Generation Family Income, Wages and Labor-Force Participation
Source: Author’s calculations using data from the 5 percent sample of the 2000 decennial census and the 2005–11 ACS. See the online appendix for details of the data sources and the regressions. a. Estimates are of the effects in adulthood of being born in a Public Use Microdata Area (PUMA) that had a federally funded family planning program, from a specification of equation 2. Event time −4 to zero is omitted, and error bars represent 95 percent confidence intervals based on heteroskedasticity-robust standard errors corrected for an arbitrary covariance structure within PUMA. The sample consists of individuals born in the United States from 1946 to 1980 who are aged 20 to 59. Data are collapsed to birth cohort category × PUMA × year of observation cells. To minimize measurement error, estimates are unweighted and exclude Chicago, Los Angeles, and New York (see Bailey and others 2013). The cell means used in the estimation include observations of zero hours or weeks worked when applicable, so regressions are estimated in levels. For ease of interpretation, the results are rescaled by dividing by the mean dependent variable in event years zero to 4. See the notes to figure 6 for details on income and employment coding and the text for more information on the specification.
Figure 11
Figure 11. Estimates of the Effects of Family Planning Programs on Next-Generation Educational Attainmenta
Source: Author’s calculations using data from the 5 percent sample of the 2000 decennial census and the 2005–11 ACS. See the online appendix for details of the data sources and the regressions. a. See the notes to figure 10 for details of the estimation..

References

    1. Alan Guttmacher Institute. Fulfilling the Promise: Public Policy and US Family Planning Clinics. New York: 2000.
    1. Almond Douglas, Currie Janet. Human Capital Development before Age Five. In: Ashenfelter O, Card D, editors. Handbook of Labor Economics. 4b. Maryland Heights, Mo: Elsevier; 2011.
    1. Ananat Elizabeth O, Hungerman Dan. The Power of the Pill for the Next Generation: Oral Contraception’s Effects on Fertility, Abortion, and Maternal & Child Characteristics. Review of Economics and Statistics. 2012;94(1):37–51. - PMC - PubMed
    1. Ananat Elizabeth, Gruber Jonathan, Levine Phillip, Staiger Douglas. Abortion and Selection. Review of Economics and Statistics. 2009;91(1):124–36.
    1. Bailey Beth L. Sex in the Heartland. Harvard University Press; 1999.

LinkOut - more resources