. 2014 Oct 7:5:1097.
doi: 10.3389/fpsyg.2014.01097. eCollection 2014.

Auditory/visual distance estimation: accuracy and variability

Affiliations

Auditory/visual distance estimation: accuracy and variability

Paul W Anderson et al. Front Psychol. .

Abstract

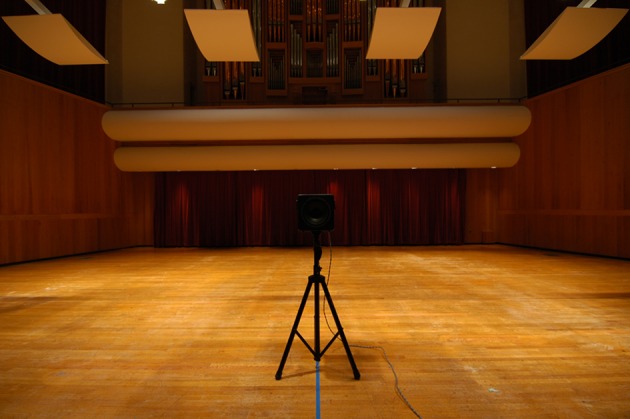
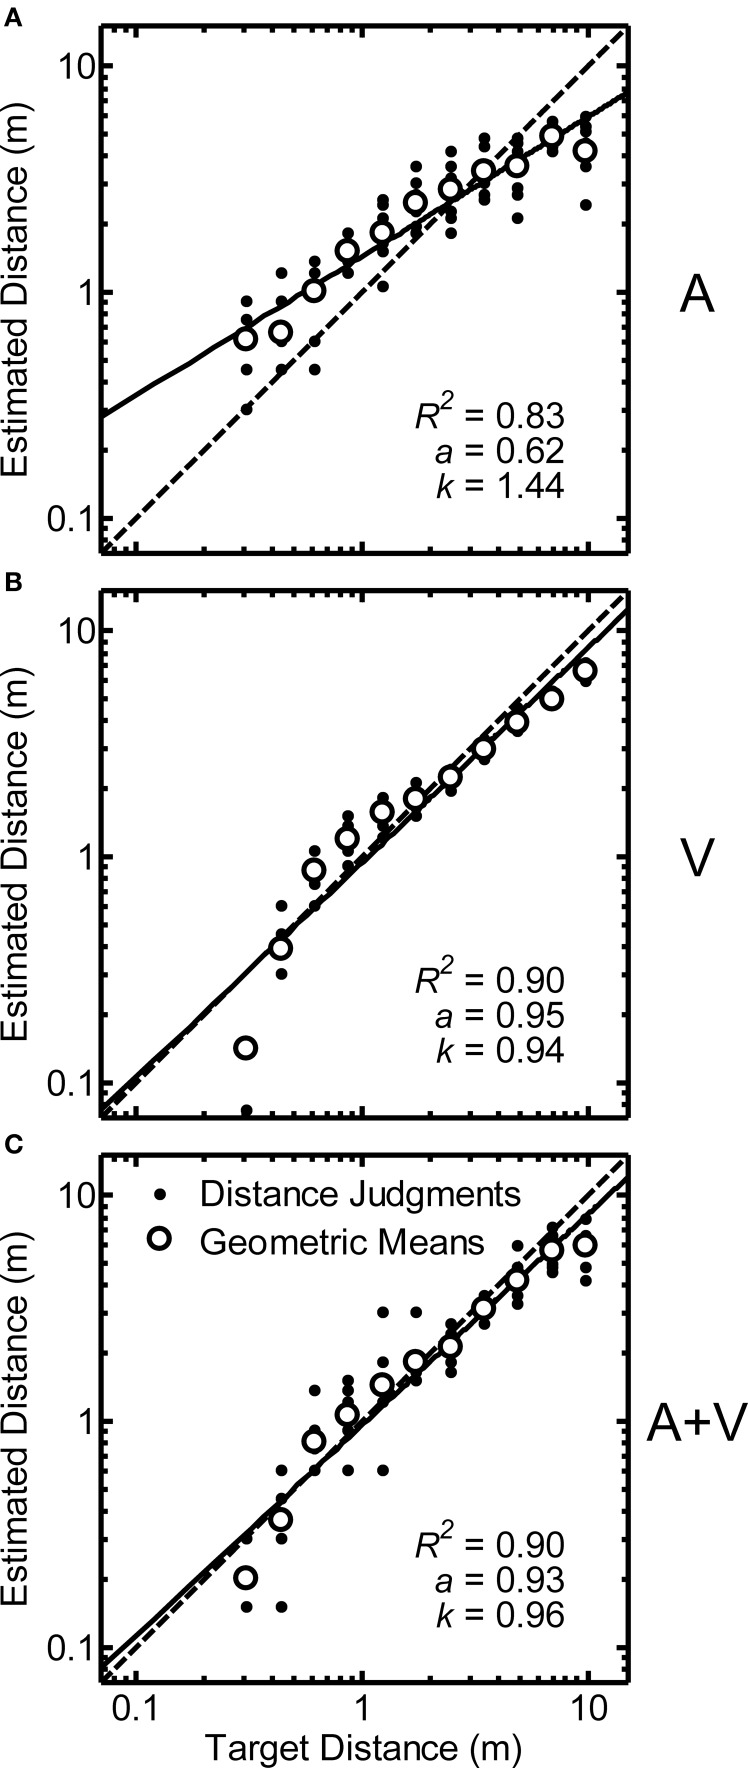
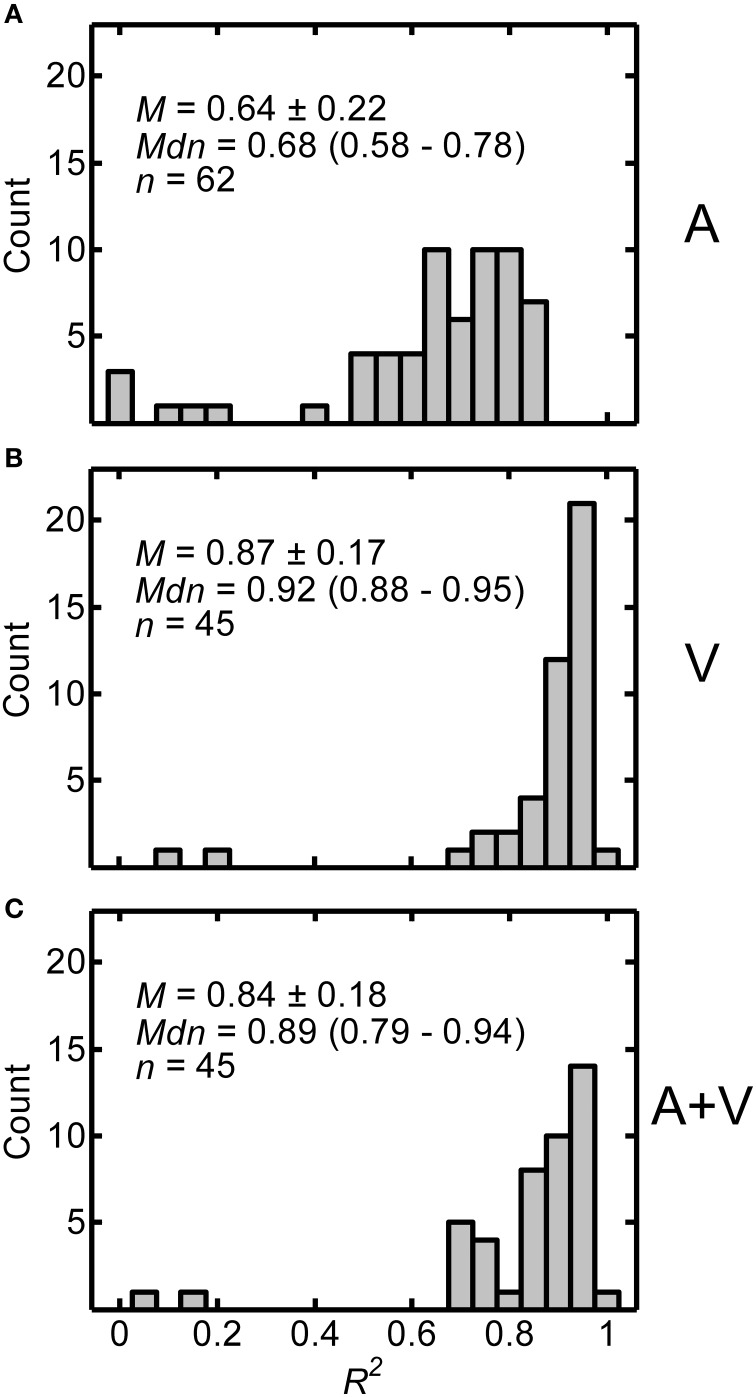
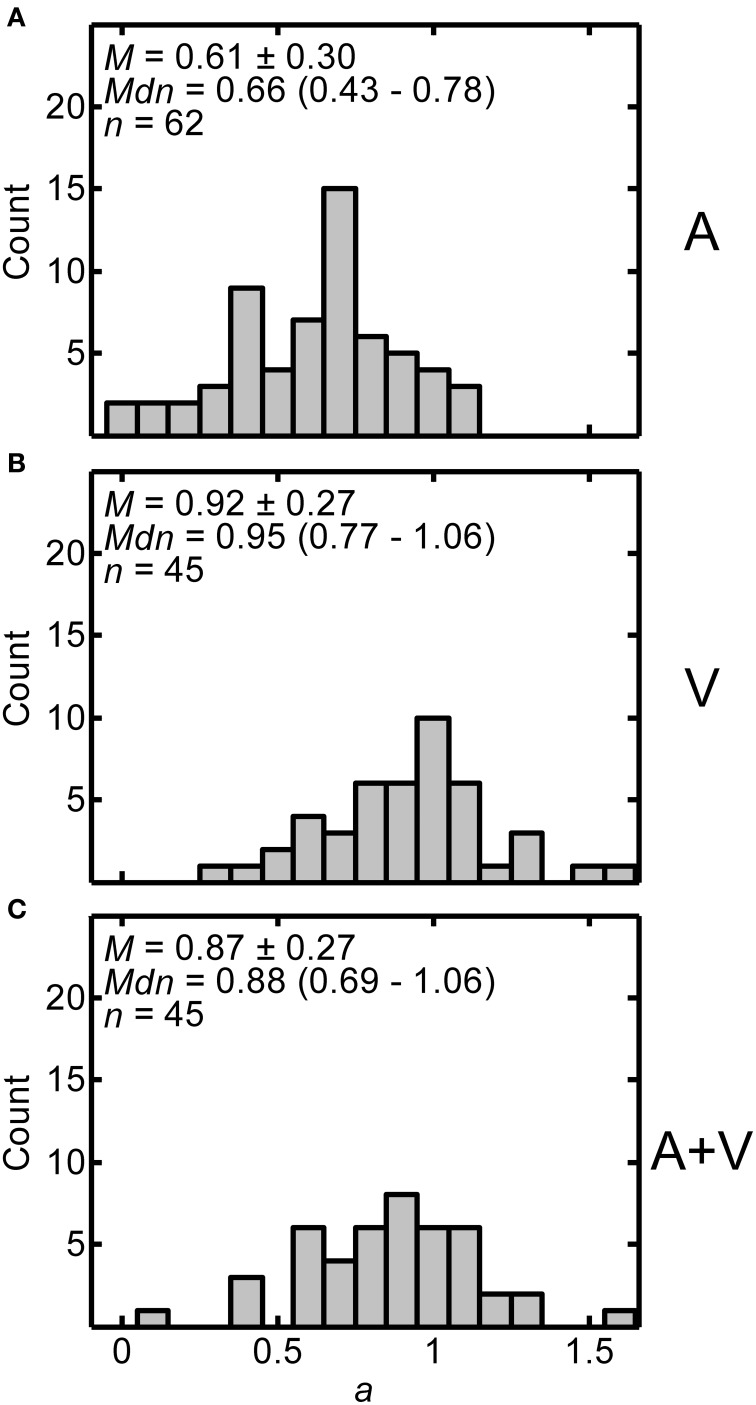
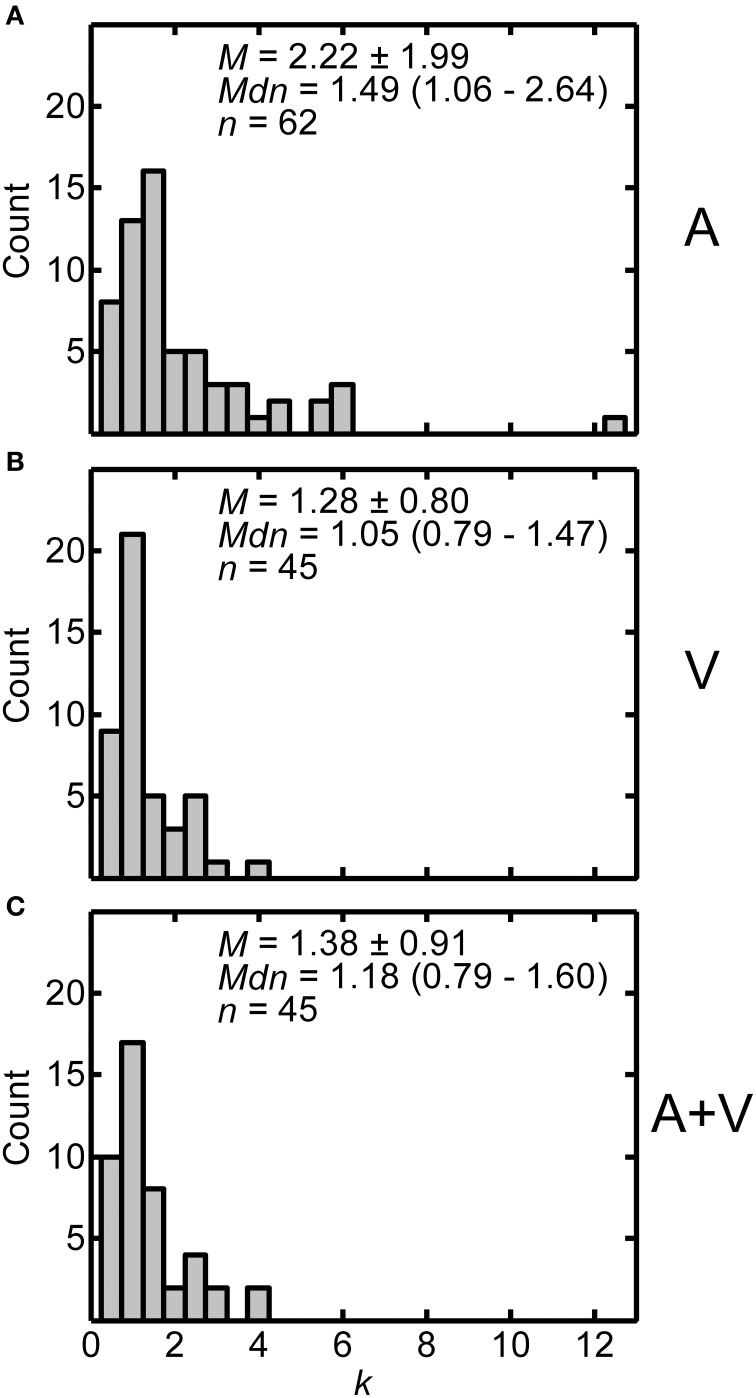
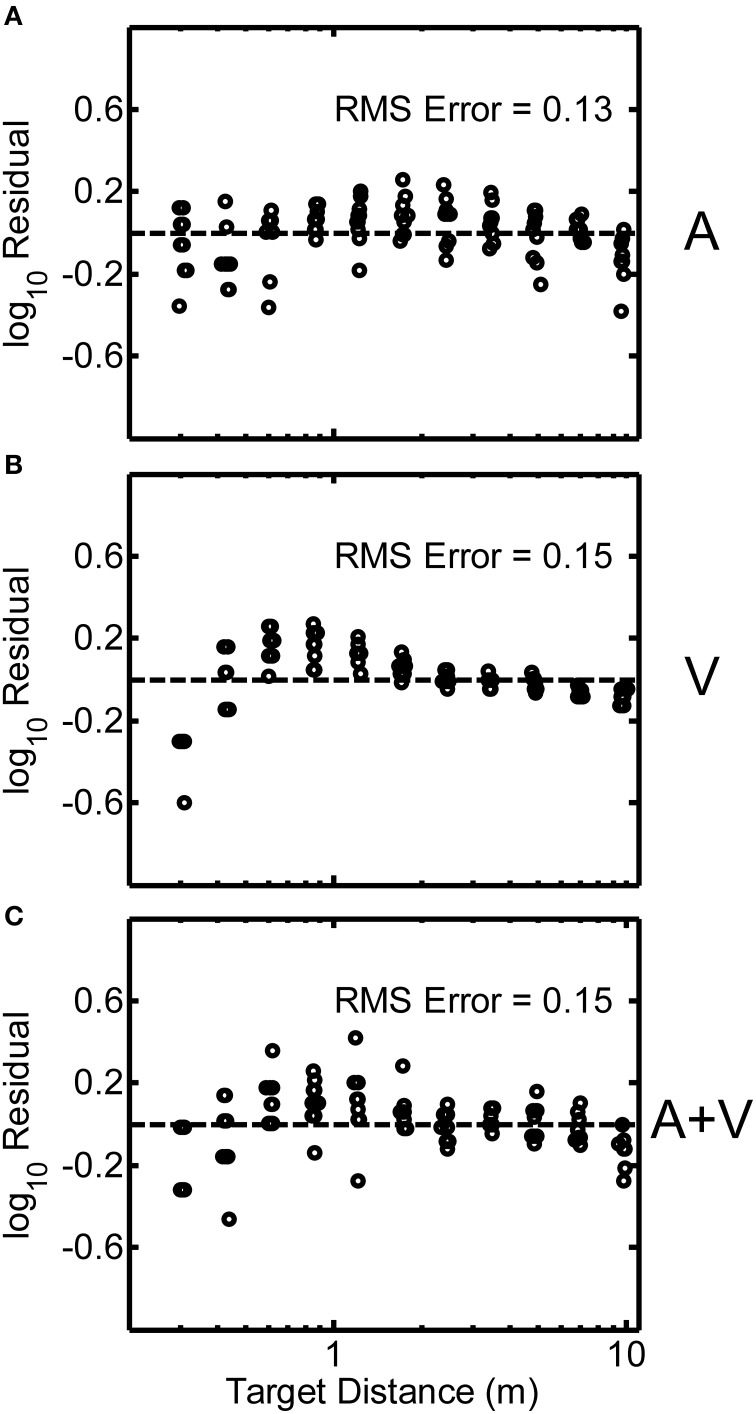
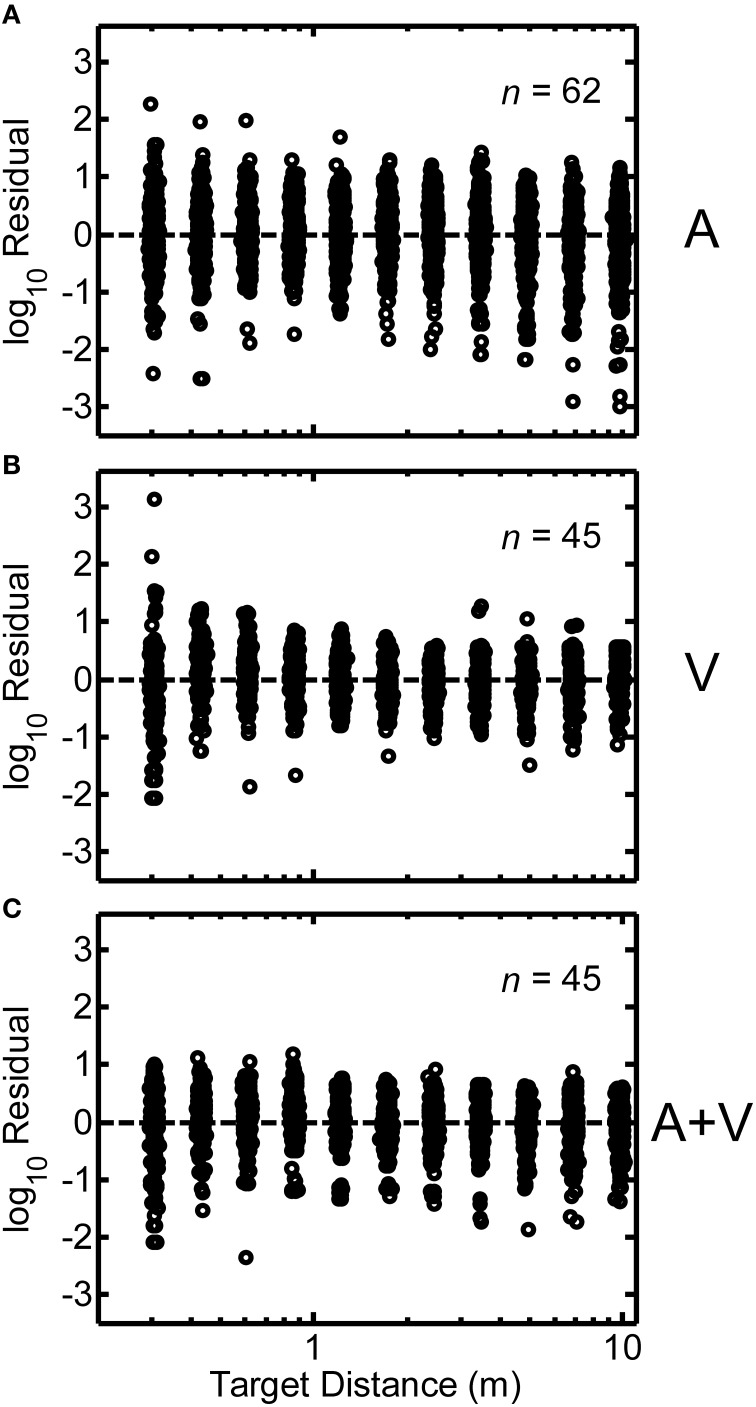
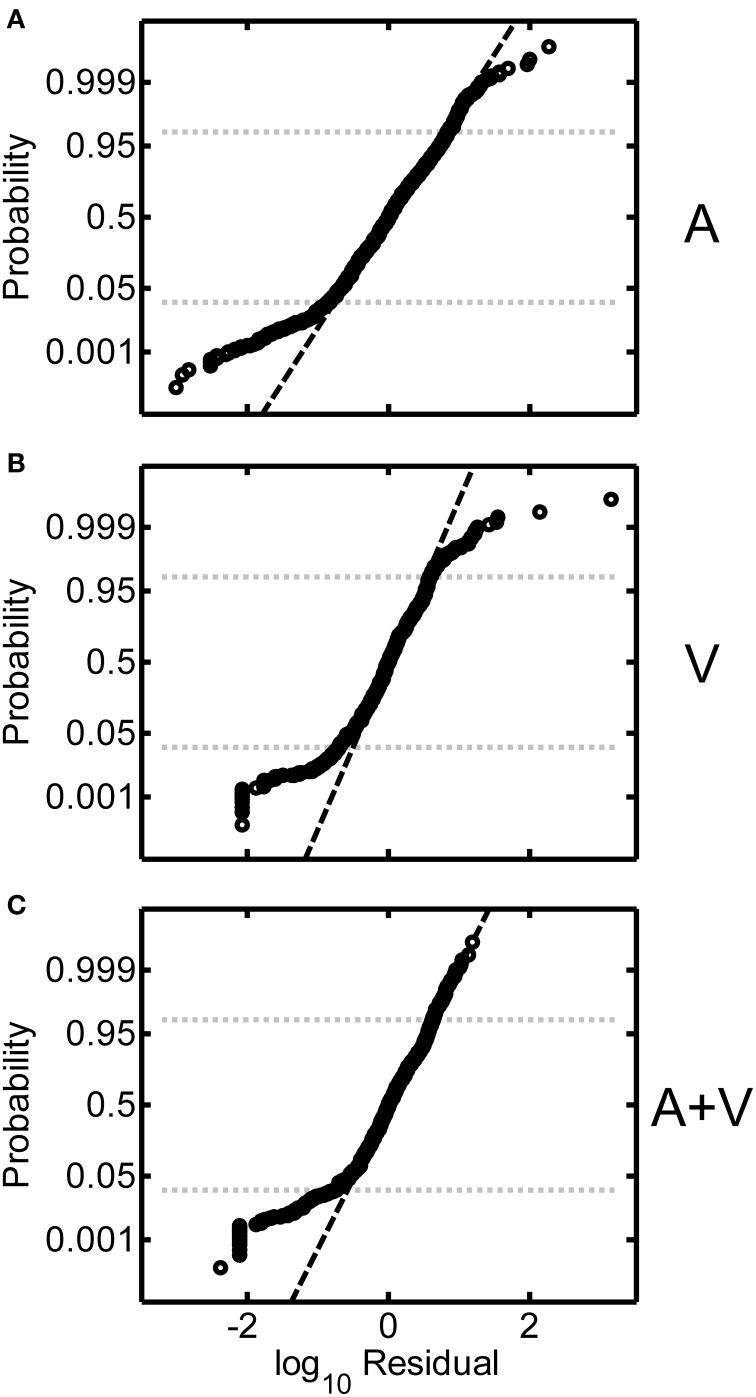
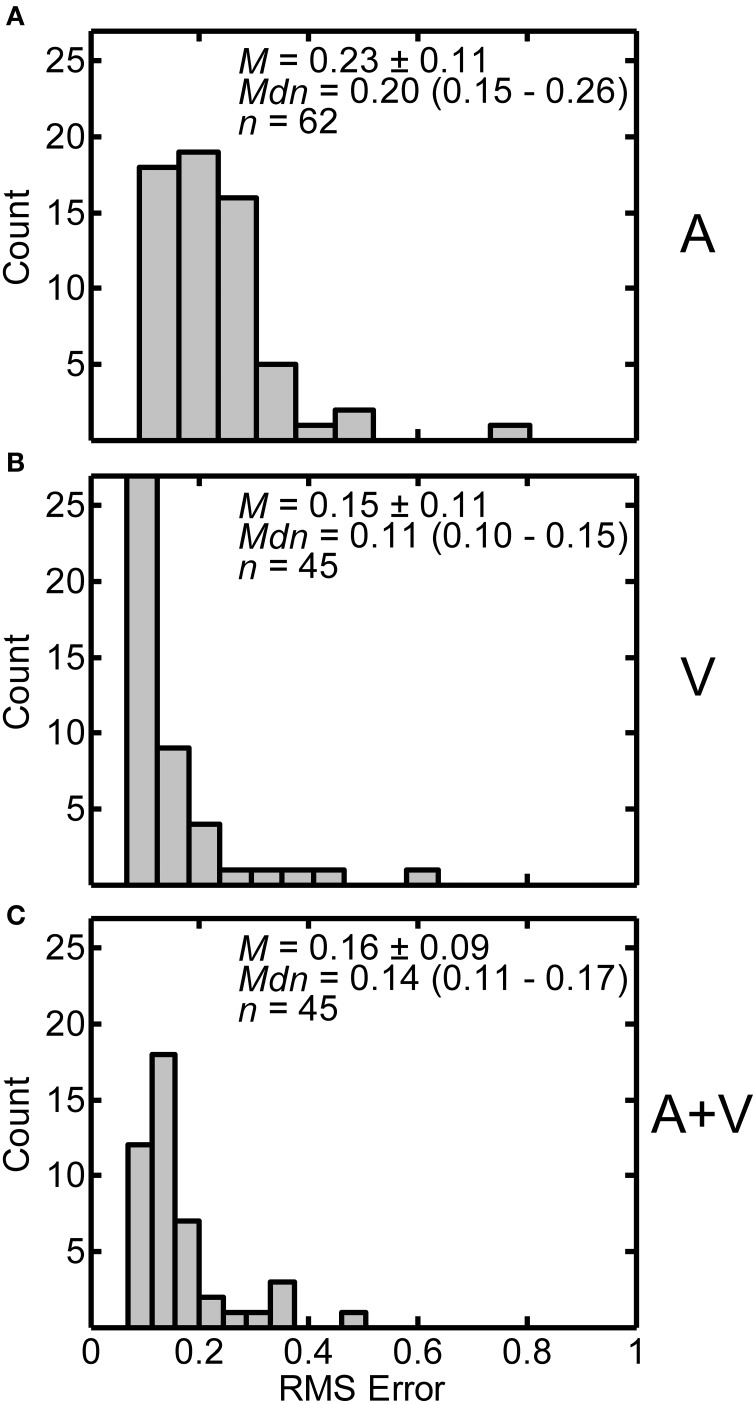
Past research has shown that auditory distance estimation improves when listeners are given the opportunity to see all possible sound sources when compared to no visual input. It has also been established that distance estimation is more accurate in vision than in audition. The present study investigates the degree to which auditory distance estimation is improved when matched with a congruent visual stimulus. Virtual sound sources based on binaural room impulse response (BRIR) measurements made from distances ranging from approximately 0.3 to 9.8 m in a concert hall were used as auditory stimuli. Visual stimuli were photographs taken from the participant's perspective at each distance in the impulse response measurement setup presented on a large HDTV monitor. Participants were asked to estimate egocentric distance to the sound source in each of three conditions: auditory only (A), visual only (V), and congruent auditory/visual stimuli (A+V). Each condition was presented within its own block. Sixty-two participants were tested in order to quantify the response variability inherent in auditory distance perception. Distance estimates from both the V and A+V conditions were found to be considerably more accurate and less variable than estimates from the A condition.

Keywords: distance perception; multimodal; sound localization; spatial hearing; virtual sound.


Figures

Figure 1
Figure 1
Visual stimulus example. A photograph of the measurement loudspeaker was taken at each distance from where the KEMAR mannequin was placed during BRIR measurement at the front of the stage. In the V and A+V conditions a photograph was presented on a large flat screen HDTV and the participant provided a distance judgment to the sound source. In this example, the measurement loudspeaker is placed 2.44 m in front of the camera in Comstock Hall.
Figure 2
Figure 2
Data from a single representative participant (code QAD) for auditory (“A,” panel A), visual (“V,” panel B), and auditory/visual (“A+V,” panel C) conditions plotted on logarithmic axes. Dots show raw distance judgments (y): 10 replications/distance. Open circles indicate geometric means (y) for each target distance. Data from each condition were fit with a power function (ŷ; solid line) of the form ŷr = kΦar (ŷr = perceived distance, k = constant, a = power-law exponent, Φr = target source distance). Fit parameters and the proportion of variability accounted for by the fit (R2) are shown in each panel. Perfectly accurate performance is indicated by the dotted line in each panel.
Figure 3
Figure 3
Distributions of R2 values from the power function fits for A (A), V (B), and A+V (C) conditions across participants. Each panel includes the following summary statistics: mean, M ± one standard deviation, median, Mdn (interquartile range), and number of participants, n, in each condition.
Figure 4
Figure 4
Distributions of exponents (a) from power fits for all participants in A (A), V (B), and A+V (C) conditions. Each panel includes the following summary statistics: mean, M ± one standard deviation, median, Mdn (interquartile range), and number of participants, n, in each condition.
Figure 5
Figure 5
Distributions of constants (k) from power fits for all participants in the A (A), V (B), and A+V (C) conditions. Each panel includes the following summary statistics: mean, M ± one standard deviation, median, Mdn (interquartile range), and number of participants, n, in each condition.
Figure 6
Figure 6
Log-transformed residuals from the power function fit for a single representative participant (code QAD, see Figure 2) for the A (A), V (B), and A+V (C) conditions. RMS error across all distances is indicated in each panel. Small random jitter was added to the target distances on the x-axis for visualization purposes.
Figure 7
Figure 7
Same as Figure 6, except results from all participants are shown. Each panel includes the number of participants per condition. Note that the spread of the residuals is relatively homogeneous as a function of distance.
Figure 8
Figure 8
Normal-probability plots of the log-transformed residuals (all participants) for the A (A), V (B), and A+V (C) conditions. The dashed diagonal line in each panel indicates normally distributed data. Probability values of 0.025 and 0.975 are shown for reference.
Figure 9
Figure 9
Distributions of RMS errors from the power function fits from individual participants in the A (A), V (B), and A+V (C) conditions. Each panel includes the following summary statistics: mean, M ± one standard deviation, median, Mdn (interquartile range), and number of participants, n, in each condition.

References

    1. Alais D., Burr D. (2004). The ventriloquist effect results from near-optimal bimodal integration. Curr. Biol. 14, 257–262 10.1016/j.cub.2004.01.029 - DOI - PubMed
    1. Ashmead D. H., Davis D. L., Northington A. (1995). Contribution of listeners' approaching motion to auditory distance perception. J. Exp. Psychol. Hum. Percept. Perform. 21, 239–256 10.1037/0096-1523.21.2.239 - DOI - PubMed
    1. Blauert J. (1997). Spatial Hearing: The Psychophysics of Human Sound Localization. Cambridge, MA: MIT press
    1. Calcagno E. R., Abregu E. L., Manuel C. E. (2012). The role of vision in auditory distance perception. Perception 41, 175–192 10.1068/p7153 - DOI - PubMed
    1. Coleman P. D. (1968). Dual role of frequency spectrum in determination of auditory distance. J. Acoust. Soc. Am. 44, 631–632 10.1121/1.1911132 - DOI - PubMed

LinkOut - more resources