

Early visual attention in preterm and fullterm infants in relation to cognitive and motor outcomes at school age: an exploratory study
- PMID: 25340045
- PMCID: PMC4186265
- DOI: 10.3389/fped.2014.00106
Early visual attention in preterm and fullterm infants in relation to cognitive and motor outcomes at school age: an exploratory study
Abstract
Objective: Preterm infants are exposed to the visual environment earlier than fullterm infants, but whether early exposure affects later development is unclear. Our aim was to investigate whether the development of visual disengagement capacity during the first 6 months postterm was associated with cognitive and motor outcomes at school age, and whether associations differed between fullterms and low-risk preterms.
Method: Seventeen fullterms and ten low-risk preterms were tested in a gaze shifting task every 4 weeks until 6 months postterm. The longitudinal data were converted into single continuous variables by fitting the data with an S-shaped curve (frequencies of looks) or an inverse model (latencies of looks). Neuropsychological test results at school age were converted into composite z scores. We then performed linear regression analyses for each functional domain at school age with the variables measuring infant visual attention as separate predictors and adjusting for maternal level of education and group (fullterms versus preterms). We included an interaction term, visual attention*group, to determine whether predictive relations differed between fullterms and preterms.
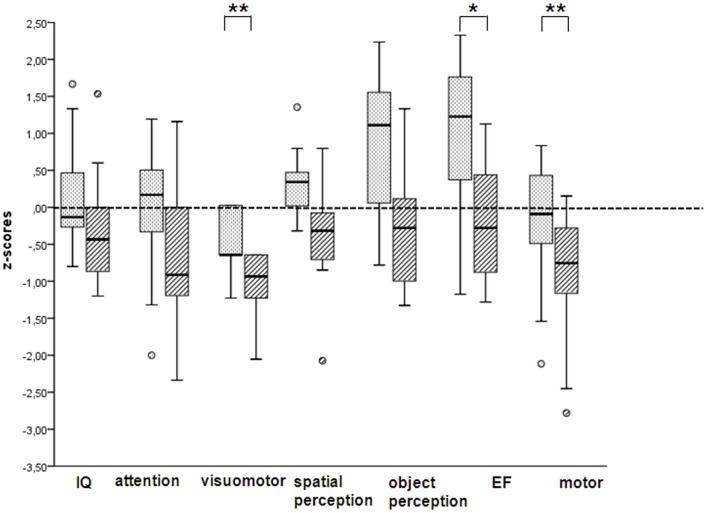
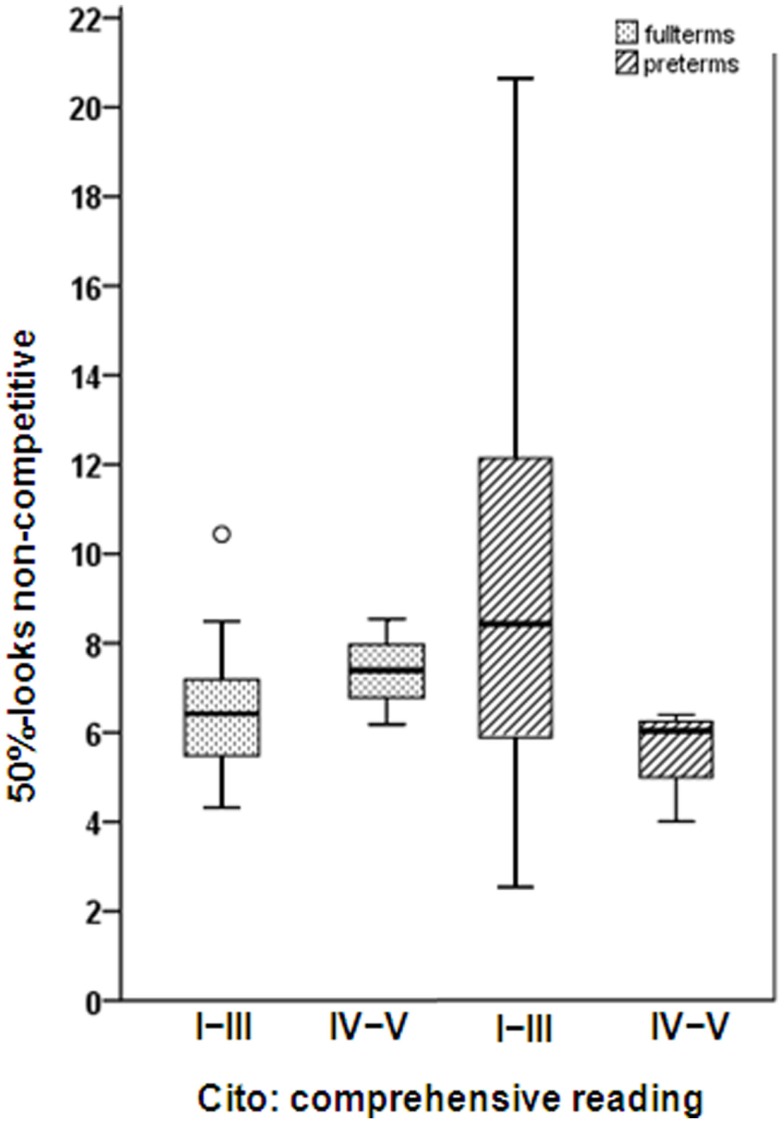
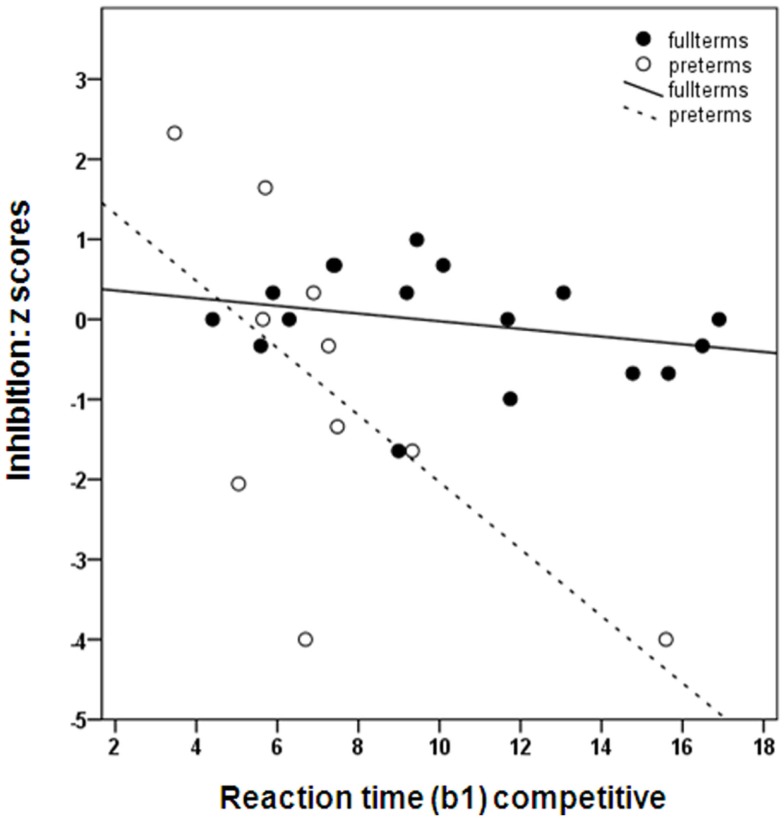
Results: A slower development of disengagement predicted poorer performance on attention, motor skills, and handwriting, irrespective of fullterm or preterm birth. Predictive relationships differed marginally between fullterms and preterms for inhibitory attentional control (P = 0.054) and comprehensive reading (P = 0.064).
Conclusion: This exploratory study yielded no indications of a clear advantage or disadvantage of the extra visual exposure in healthy preterm infants. We tentatively conclude that additional visual exposure does not interfere with the ongoing development of neuronal networks during this vulnerable period of brain development.
Keywords: cognition; frequency of looks; functional development; longitudinal study; low-risk preterm infants; motor skills; response latencies; visual competing stimuli.
Figures
Similar articles
-
Associations between developmental trajectories of movement variety and visual attention in fullterm and preterm infants during the first six months postterm.Early Hum Dev. 2015 Jan;91(1):89-96. doi: 10.1016/j.earlhumdev.2014.12.006. Epub 2014 Dec 31. Early Hum Dev. 2015. PMID: 25556578
-
Delayed early primary visual pathway development in premature infants: high density electrophysiological evidence.PLoS One. 2014 Sep 30;9(9):e107992. doi: 10.1371/journal.pone.0107992. eCollection 2014. PLoS One. 2014. PMID: 25268226 Free PMC article.
-
Changes in red cell phosphate metabolism of preterm and fullterm infants with perinatal problems during their first month of life.Eur J Pediatr. 2008 Feb;167(2):211-8. doi: 10.1007/s00431-007-0464-5. Epub 2007 Apr 26. Eur J Pediatr. 2008. PMID: 17458560
-
Omega-3 Fatty Acids and Maternal and Child Health: An Updated Systematic Review.Evid Rep Technol Assess (Full Rep). 2016 Oct;(224):1-826. doi: 10.23970/AHRQEPCERTA224. Evid Rep Technol Assess (Full Rep). 2016. PMID: 30307735
-
Precursors to language in preterm infants: speech perception abilities in the first year of life.Prog Brain Res. 2011;189:239-57. doi: 10.1016/B978-0-444-53884-0.00028-2. Prog Brain Res. 2011. PMID: 21489393 Review.
Cited by
-
Rapid Infant Prefrontal Cortex Development and Sensitivity to Early Environmental Experience.Dev Rev. 2018 Jun;48:113-144. doi: 10.1016/j.dr.2018.02.003. Epub 2018 Mar 11. Dev Rev. 2018. PMID: 30270962 Free PMC article.
-
Executive function deficits in children born preterm or at low birthweight: a meta-analysis.Dev Med Child Neurol. 2019 Sep;61(9):1015-1024. doi: 10.1111/dmcn.14213. Epub 2019 Apr 3. Dev Med Child Neurol. 2019. PMID: 30945271 Free PMC article. Review.
-
Motor Development Comparison between Preterm and Full-Term Infants Using Alberta Infant Motor Scale.Int J Environ Res Public Health. 2023 Feb 21;20(5):3819. doi: 10.3390/ijerph20053819. Int J Environ Res Public Health. 2023. PMID: 36900838 Free PMC article.
-
The Davida Teller Award Lecture, 2016: Visual Brain Development: A review of "Dorsal Stream Vulnerability"-motion, mathematics, amblyopia, actions, and attention.J Vis. 2017 Mar 1;17(3):26. doi: 10.1167/17.3.26. J Vis. 2017. PMID: 28362900 Free PMC article. Review.
References
-
- Butcher PR, Kalverboer AF, Geuze RH. Infants’ shifts of gaze from a central to a peripheral stimulus: a longitduinal study of development between 6 and 26 weeks. Infant Behav Dev (2000) 23:3–2110.1016/S0163-6383(00)00031-X - DOI
-
- Hood BM, Atkinson J. Disengaging visual attention in the infant and adult. Infant Behav Dev (1993) 16:405–2210.1016/0163-6383(93)80001-O - DOI
LinkOut - more resources
Full Text Sources
Other Literature Sources