. 2014 Oct 23;10(10):e1003898.
doi: 10.1371/journal.pcbi.1003898. eCollection 2014 Oct.

A taxonomy of bacterial microcompartment loci constructed by a novel scoring method

Affiliations

A taxonomy of bacterial microcompartment loci constructed by a novel scoring method

Seth D Axen et al. PLoS Comput Biol. .

Abstract

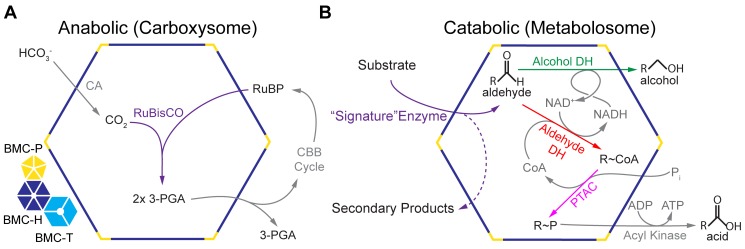
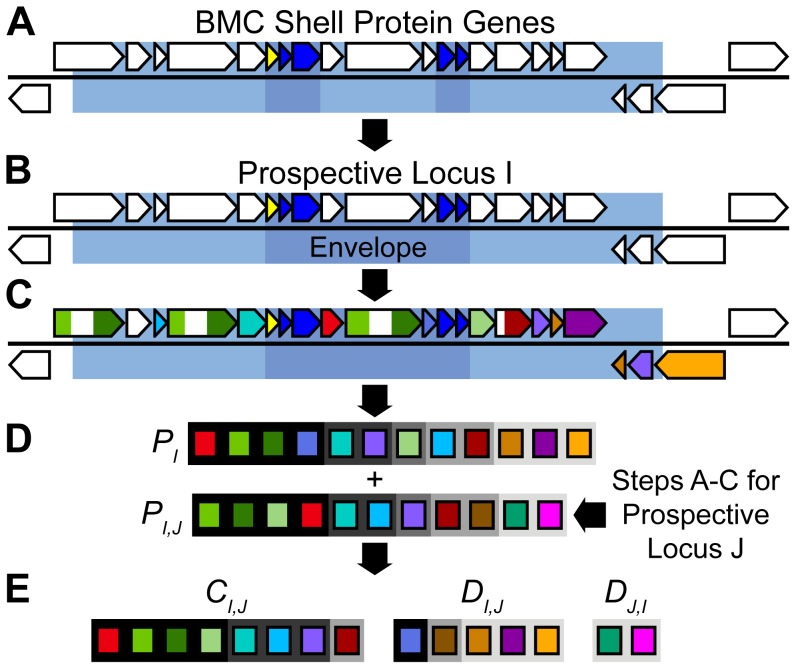
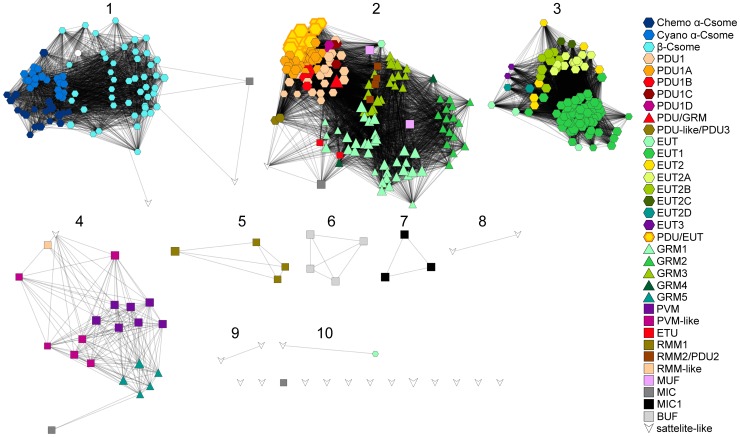
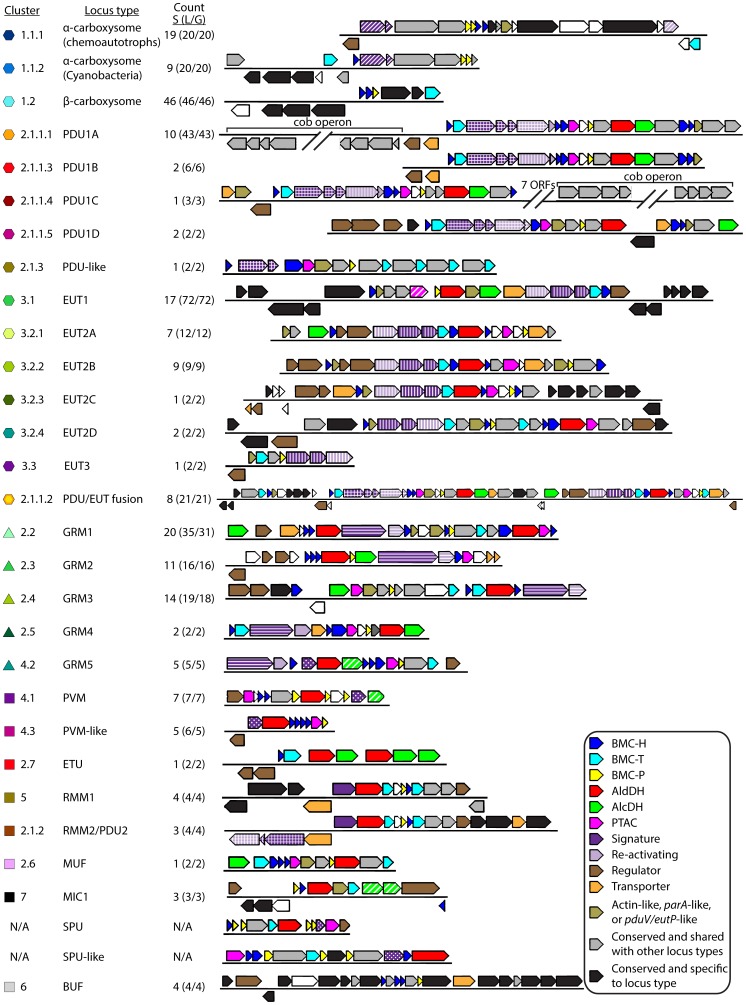
Bacterial microcompartments (BMCs) are proteinaceous organelles involved in both autotrophic and heterotrophic metabolism. All BMCs share homologous shell proteins but differ in their complement of enzymes; these are typically encoded adjacent to shell protein genes in genetic loci, or operons. To enable the identification and prediction of functional (sub)types of BMCs, we developed LoClass, an algorithm that finds putative BMC loci and inventories, weights, and compares their constituent pfam domains to construct a locus similarity network and predict locus (sub)types. In addition to using LoClass to analyze sequences in the Non-redundant Protein Database, we compared predicted BMC loci found in seven candidate bacterial phyla (six from single-cell genomic studies) to the LoClass taxonomy. Together, these analyses resulted in the identification of 23 different types of BMCs encoded in 30 distinct locus (sub)types found in 23 bacterial phyla. These include the two carboxysome types and a divergent set of metabolosomes, BMCs that share a common catalytic core and process distinct substrates via specific signature enzymes. Furthermore, many Candidate BMCs were found that lack one or more core metabolosome components, including one that is predicted to represent an entirely new paradigm for BMC-associated metabolism, joining the carboxysome and metabolosome. By placing these results in a phylogenetic context, we provide a framework for understanding the horizontal transfer of these loci, a starting point for studies aimed at understanding the evolution of BMCs. This comprehensive taxonomy of BMC loci, based on their constituent protein domains, foregrounds the functional diversity of BMCs and provides a reference for interpreting the role of BMC gene clusters encoded in isolate, single cell, and metagenomic data. Many loci encode ancillary functions such as transporters or genes for cofactor assembly; this expanded vocabulary of BMC-related functions should be useful for design of genetic modules for introducing BMCs in bioengineering applications.


Conflict of interest statement

The authors have declared that no competing interests exist.

Figures

Figure 1
Figure 1. Schematic overview of characterized bacterial microcompartments.
(A) Carboxysome. (B) Metabolosome. An example substrate is ethanolamine and the signature enzyme produces acetaldehyde and ammonia, a secondary product. Reactions in gray are peripheral reactions to the core BMC chemistry. BMC shell protein oligomers are depicted on the left: blue, BMC-H; cyan, BMC-T; yellow, BMC-P. 3-PGA, 3-phosphoglycerate, and RuBP, ribulose 1,5-bisphosphate.
Figure 2
Figure 2. Simplified workflow of LoClass for locus similarity network generation.
(A) After genes encoding BMC shell proteins (PF00936, dark blue; PF03319, yellow) are identified using hmmsearch, their position on the chromosome is determined. The region 10 kb upstream and downstream of each PF00936 and PF03319 domain is considered a Prospective BMC Locus (pale blue). The envelope (blue) is defined as the maximal portion of the Prospective BMC Locus bounded by BMC shell protein genes. (B) Where Prospective BMC Loci overlap, they are merged into one Prospective Locus. (C) All non-shell protein genes in the Prospective Locus are searched against Pfam . Pfam hits are represented by colored regions of the genes. Genes without pfams hits (white) are not considered. (D) Loci are represented by their pfam set, excluding genes containing PF00936 and PF03319 domains. Pfams, represented by colored rectangles, are weighted based on their relative distance from the envelope. This distance weight is represented by the darkness of the background behind the rectangles, where a black background corresponds to a pfam found inside the envelope with a weight of 1, and where a light grey background corresponds to a pfam separated from the envelope by at least four open reading frames with a weight of 0.6. PI is the set of pfams found in Locus I, while PJ represents the set of pfams found in a different Locus J (not shown). (E) By comparing the sets of pfams PI and PJ, we determine the set CI,J of common pfams to both loci and the two sets DI,J and DJ,I of pfams unique to Locus I and Locus J, respectively. These three sets, along with the distance weight and the other weights (Materials and Methods) are then used to calculate the locus similarity score between these two loci.
Figure 3
Figure 3. Similarity network of bacterial microcompartment loci.
Nodes represent all Candidate BMC Loci and satellite-like loci analyzed using LoClass. The length of any given edge between two nodes is proportional to the pairwise locus similarity score as generated using the LoClass method. The locus similarity network was clustered using MCL at a score cut-off of 3 and inflation value of 2, resulting in 10 different clusters. Node sizes are proportional to the number of genes in the envelope, the maximal region in the locus bounded by BMC shell protein genes. Node colors and shapes correspond to the locus (sub)type as predicted by our analysis (see key). The white circle in Cluster 1 indicates a locus in a synthetic genome not included in our analysis .
Figure 4
Figure 4. Representative BMC Loci.
Cartoon representation of the most highly conserved contiguous region of the Representative Loci, in order of appearance in the text. Where a (sub)type is dominated by many highly syntenic examples from one or two species, locus bounds were chosen based on conservation across all species in the (sub)type. Locus statistics are represented in the “S (L/G)” column: “S” represents number of species that contain the locus, “L” represents the number of loci, and “G” represents the number of genomes that encode the locus. Genes are color-coded according to their annotation: blue, BMC-H; cyan, BMC-T; yellow, BMC-P; red, aldehyde dehydrogenase; green, iron-containing alcohol dehydrogenase; green diagonal hash, other putative alcohol dehydrogenases; solid pink, pduL-type phosphotransacylase; pink diagonal hash, pta-type phosphotransacylase; purple diagonal hash, RuBisCO large and small subunits; purple vertical hash, ethanolamine ammonia lyase subunits; purple crosshatch, propanediol dehydratase subunits; purple horizontal hash, glycyl radical enzyme and activase; dotted purple, aldolase; solid purple, aminotransferase; brown, regulatory element including two-component signaling elements; orange, transporter; teal, actin/parA/pduV/eutP-like. Genes colored gray indicate that the gene is present in over 50% of members in the locus (sub)type described (e.g. GRM1), and are in over 50% of members of at least one other locus (sub)type (e.g. found in GRM1 and GRM3). Genes colored black indicate that the gene is present in over 50% of members in the locus (sub)type described and not present in over 50% of members of any other locus (sub)type. Genes colored white are those that are present in the Representative Locus but are not present in over 50% of members of that locus (sub)type. Representative Loci are highlighted in yellow in Dataset S1.
Figure 5
Figure 5. Phylogeny of aldehyde dehydrogenases.
Tree root is denoted by arrow. Branches are color coded according to general classification of the locus in which the aldehyde dehydrogenase is encoded: red, PDU; cyan, EUT; green, GRM; pink, PVM and PVM-like; purple, RMM; brown, ETU; black, MUF and others. SAT-like refers to satellite-like loci. Asterisks (*) annotate outlier taxa discussed in text. If bootstrap support of a node separating branches of differing color were above 50% or 75%, they were denoted by open or closed circles, respectively. Scale bar represents number of substitutions per position.
Figure 6
Figure 6. Bacterial phyla tree with distribution of BMC locus types.
The classified BMC locus types, excluding satellite and satellite-like loci, denoted as colored shapes are adjacent to the phyla in which they appear. For a given phylum, the shape of the triangular wedge represents sequence diversity; the nearest edge represents the shortest branch length from the phylum node to a leaf, while the farthest edge represents the longest branch length from the phylum node to a leaf. Phyla marked with an asterisk (*) are not in NR but contain BMC loci; the data were retrieved from IMG (Materials and Methods). Phylum tree based on with expansion by Christian Rinke.

References

    1. Van Niftrik L, Jetten MSM (2012) Anaerobic ammonium-oxidizing bacteria: unique microorganisms with exceptional properties. Microbiol Mol Biol Rev 76: 585–596 Available: http://www.ncbi.nlm.nih.gov/pmc/articles/PMC3429623/. Accessed 23 May 2014. - PMC - PubMed
    1. Cornejo E, Abreu N, Komeili A (2014) Compartmentalization and organelle formation in bacteria. Curr Opin Cell Biol 26: 132–138 Available: http://www.ncbi.nlm.nih.gov/pubmed/24440431. Accessed 23 May 2014. - PMC - PubMed
    1. Kerfeld CA, Heinhorst S, Cannon GC (2010) Bacterial microcompartments. Annu Rev Microbiol 64: 391–408 Available: http://www.ncbi.nlm.nih.gov/pubmed/20825353. Accessed 29 April 2014. - PubMed
    1. Cheng S, Liu Y, Crowley CS, Yeates TO, Bobik TA (2008) Bacterial microcompartments: their properties and paradoxes. Bioessays 30: 1084–1095 Available: http://www.ncbi.nlm.nih.gov/pmc/articles/PMC3272490/. Accessed 23 May 2014. - PMC - PubMed
    1. Yeates TO, Jorda J, Bobik TA (2013) The shells of BMC-type microcompartment organelles in bacteria. J Mol Microbiol Biotechnol 23: 290–299 Available: http://www.karger.com/Article/FullText/351347. Accessed 23 May 2014. - PMC - PubMed

Publication types