. 2014 Oct 23;10(10):e1004609.
doi: 10.1371/journal.pgen.1004609. eCollection 2014 Oct.

Recovery from an acute infection in C. elegans requires the GATA transcription factor ELT-2

Affiliations

Recovery from an acute infection in C. elegans requires the GATA transcription factor ELT-2

Brian Head et al. PLoS Genet. .

Erratum in

Abstract

The mechanisms involved in the recognition of microbial pathogens and activation of the immune system have been extensively studied. However, the mechanisms involved in the recovery phase of an infection are incompletely characterized at both the cellular and physiological levels. Here, we establish a Caenorhabditis elegans-Salmonella enterica model of acute infection and antibiotic treatment for studying biological changes during the resolution phase of an infection. Using whole genome expression profiles of acutely infected animals, we found that genes that are markers of innate immunity are down-regulated upon recovery, while genes involved in xenobiotic detoxification, redox regulation, and cellular homeostasis are up-regulated. In silico analyses demonstrated that genes altered during recovery from infection were transcriptionally regulated by conserved transcription factors, including GATA/ELT-2, FOXO/DAF-16, and Nrf/SKN-1. Finally, we found that recovery from an acute bacterial infection is dependent on ELT-2 activity.


Conflict of interest statement

The authors have declared that no competing interests exist.

Figures

Figure 1
Figure 1. Tetracycline treatment models S. enterica acute infection in C. elegans.
(A) fer-1(b232ts) L1 animals were exposed to S. enterica—GFP for 72 hours. (B) fer-1(b232ts) L1 animals were exposed to S. enterica—GFP for 72 hours and transferred to the indicated plates for 24 hours. (C) fer-1(b232ts) L1 animals were exposed to S. enterica—GFP for 96 hours and transferred to the indicated plates for 24 hours. At each time point, overall GFP intensity in the intestinal lumen was determined using an MZFLIII Leica stereomicroscope. Three levels of colonization were determined as heavy, weak, or none as described in Materials and Methods. N = 104–150 animals per condition. The graph represents the combined results of 2 independent experiments. (D) Quantification of colony forming units of fer-1(b232ts) L1 animals exposed to S. enterica—GFP for 72 hours, S. enterica—GFP for 96 hours, or S. enterica—GFP for 72 hours and then treated with Tetracycline for 24 hours. N = 10 animals per condition. The graph represents the combined results of 4 independent experiments. (E) fer-1(b232ts) L1 animals were exposed to E. coli or S. enterica—GFP for 72 hours and then transferred to E. coli plus Tetracycline or S. enterica—GFP. Animals were scored for survival 72 hour post initial exposure to S. enterica. N = 60 animals per condition. The graph represents the combined results of 5 independent experiments.
Figure 2
Figure 2. Whole genome expression analysis reveals down-regulated immune response genes and up-regulated detoxification genes during resolution of acute S. enterica infection.
(A) Flowchart of animal cohorts collected for the microarray analysis. (B) Gene ontology analysis of genes regulated during recovery at the 96 and 120 hour time points using the DAVID Bioinformatics Database. Enrichment scores of the 96-hour and 120-hour down-regulated clusters are shown in the left panel. Enrichment scores of the 96-hour and 120-hour up-regulated clusters are shown in the right panel. (C) Venn diagrams showing the overlap of the 96-hour and 120-hour down-regulated genes, left, and overlap of the 96-hour and 120-hour up-regulated genes, right. Representation factors are 43.5 and 64.3, respectively.
Figure 3
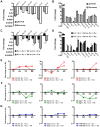
Figure 3. Gene expression changes in infected animals treated with Tetracycline.
(A–B) Transcript levels of 6 selected down-regulated genes (A) and 10 selected up-regulated genes (B) from L1 animals grown on S. enterica for 72 hours and then treated with Tetracycline for 24 hours relative to L1 animals grown on S. enterica for 96 hours. Out of the 17 studied genes, only the 16 validated genes are shown. Gray bars represent fold change as determined using qRT-PCR. White bars represent fold change as determined using microarrays. (C–D) Transcript levels of 6 selected down-regulated genes (C) and 10 selected up-regulated genes (D) as determined using qRT-PCR. Black bars represent gene expression changes in L1 animals grown on E. coli for 72 hours and then treated with Tetracycline for 24 hours relative to L1 animals grown on E. coli for 96 hours. Gray bars represent gene expression changes in L1 animals grown on S. enterica for 72 hours and then treated with Tetracycline for 24 hours relative to animals grown on S. enterica for 96 hours. qRT-PCR studies were performed in triplicate. SEM is shown. Statistical significance is indicated (p<0.05: *). (E–G) Transcript levels of 3 selected down-regulated genes (E), 3 selected up-regulated genes (F), and 3 selected housekeeping genes (F) over the infection time course. The expression values of animals grown on S. enterica for 72 hours and then treated with Tetracycline for 24 hours are denoted with open circles. The expression values of animals grown on S. enterica for 96 hours are denoted with an X.
Figure 4
Figure 4. ELT-2 regulates the expression of specific genes during recovery.
(A) Representation factors of previously studied data sets that overlap with genes altered during recovery at the 96-hour time point. (B) Percentage of down- and up-regulated recovery genes with at least one TGATAA site in the 1.5 kb sequence upstream of the transcriptional start site. Randomly selected gene sets are included as controls. (C–D) Transcript levels of 3 selected down-regulated genes (C) and 5 selected up-regulated genes (D) as determined using qRT-PCR. Gray bars represent gene expression changes in control fer-1(b232ts) young adult animals exposed to S. enterica—GFP for 36 hours and then treated with Tetracycline for 24 hours relative to control fer-1(b232ts) young adult animals grown on S. enterica—GFP for 60 hours. Checkered gray bars represent gene expression changes in fer-1(b232ts) elt-2(RNAi) young adult animals exposed to S. enterica for 36 hours and then treated with Tetracycline for 24 hours relative to control fer-1(b232ts) young adult animals exposed to S. enterica—GFP for 36 hours and then treated with Tetracycline for 24 hours. qRT-PCR studies were performed in duplicate. SEM is shown.
Figure 5
Figure 5. elt-2(RNAi) animals are unable to resolve an infection.
(A) Control fer-1(b232ts) or fer-1(b232ts) elt-2(RNAi) young adult animals were exposed to E. coli or S. enterica—GFP for 36 hours and then transferred to E. coli or S. enterica—GFP and scored for survival. (B) Control fer-1(b232ts) or fer-1(b232ts) elt-2(RNAi) animals were exposed to E. coli or S. enterica—GFP for 36 hours and then transferred to E. coli or E. coli plus Tetracycline and scored for survival. (C) Control fer-1(b232ts) or fer-1(b232ts) pmk-1(RNAi) young adult animals were exposed to E. coli or S. enterica—GFP for 36 hours and then transferred to E. coli or S. enterica—GFP and scored for survival. (D) Control fer-1(b232ts) or fer-1(b232ts) pmk-1(RNAi) animals were exposed to E. coli or S. enterica—GFP for 36 hours and then transferred to E. coli or E. coli plus Tetracycline and scored for survival. N = 60 animals per condition. The graphs represent the combined results of 3 independent experiments.

References

    1. Darby C (2005) Interactions with microbial pathogens. WormBook: 1–15. - PMC - PubMed
    1. Tenor JL, McCormick BA, Ausubel FM, Aballay A (2004) Caenorhabditis elegans-based screen identifies Salmonella virulence factors required for conserved host-pathogen interactions. Curr Biol 14: 1018–1024. - PubMed
    1. Tan MW, Rahme LG, Sternberg JA, Tompkins RG, Ausubel FM (1999) Pseudomonas aeruginosa killing of Caenorhabditis elegans used to identify P. aeruginosa virulence factors. Proc Natl Acad Sci U S A 96: 2408–2413. - PMC - PubMed
    1. Garsin DA, Sifri CD, Mylonakis E, Qin X, Singh KV, et al. (2001) A simple model host for identifying Gram-positive virulence factors. Proc Natl Acad Sci U S A 98: 10892–10897. - PMC - PubMed
    1. Pukkila-Worley R, Ausubel FM (2012) Immune defense mechanisms in the Caenorhabditis elegans intestinal epithelium. Curr Opin Immunol 24: 3–9. - PMC - PubMed

Publication types

MeSH terms

Substances