Energy landscape of all-atom protein-protein interactions revealed by multiscale enhanced sampling
- PMID: 25340714
- PMCID: PMC4207830
- DOI: 10.1371/journal.pcbi.1003901
Energy landscape of all-atom protein-protein interactions revealed by multiscale enhanced sampling
Abstract
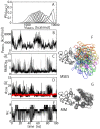
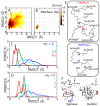
Protein-protein interactions are regulated by a subtle balance of complicated atomic interactions and solvation at the interface. To understand such an elusive phenomenon, it is necessary to thoroughly survey the large configurational space from the stable complex structure to the dissociated states using the all-atom model in explicit solvent and to delineate the energy landscape of protein-protein interactions. In this study, we carried out a multiscale enhanced sampling (MSES) simulation of the formation of a barnase-barstar complex, which is a protein complex characterized by an extraordinary tight and fast binding, to determine the energy landscape of atomistic protein-protein interactions. The MSES adopts a multicopy and multiscale scheme to enable for the enhanced sampling of the all-atom model of large proteins including explicit solvent. During the 100-ns MSES simulation of the barnase-barstar system, we observed the association-dissociation processes of the atomistic protein complex in solution several times, which contained not only the native complex structure but also fully non-native configurations. The sampled distributions suggest that a large variety of non-native states went downhill to the stable complex structure, like a fast folding on a funnel-like potential. This funnel landscape is attributed to dominant configurations in the early stage of the association process characterized by near-native orientations, which will accelerate the native inter-molecular interactions. These configurations are guided mostly by the shape complementarity between barnase and barstar, and lead to the fast formation of the final complex structure along the downhill energy landscape.
Conflict of interest statement
The authors have declared that no competing interests exist.
Figures


Similar articles
-
Free-Energy Landscape of Protein-Ligand Interactions Coupled with Protein Structural Changes.J Phys Chem B. 2017 Feb 2;121(4):731-740. doi: 10.1021/acs.jpcb.6b11696. Epub 2017 Jan 18. J Phys Chem B. 2017. PMID: 28052666
-
Downhill binding energy surface of the barnase-barstar complex.Biopolymers. 2010 Nov;93(11):977-85. doi: 10.1002/bip.21507. Biopolymers. 2010. PMID: 20540151
-
Incorporating receptor flexibility in the molecular design of protein interfaces.Protein Eng Des Sel. 2009 Sep;22(9):575-86. doi: 10.1093/protein/gzp042. Epub 2009 Jul 30. Protein Eng Des Sel. 2009. PMID: 19643976
-
Enhanced conformational sampling to visualize a free-energy landscape of protein complex formation.Biochem J. 2016 Jun 15;473(12):1651-62. doi: 10.1042/BCJ20160053. Biochem J. 2016. PMID: 27288028 Free PMC article. Review.
-
Using the folding landscapes of proteins to understand protein function.Curr Opin Struct Biol. 2016 Feb;36:67-74. doi: 10.1016/j.sbi.2016.01.001. Epub 2016 Jan 24. Curr Opin Struct Biol. 2016. PMID: 26812092 Review.
Cited by
-
Exploring Configuration Space and Path Space of Biomolecules Using Enhanced Sampling Techniques-Searching for Mechanism and Kinetics of Biomolecular Functions.Int J Mol Sci. 2018 Oct 15;19(10):3177. doi: 10.3390/ijms19103177. Int J Mol Sci. 2018. PMID: 30326661 Free PMC article.
-
Protein-Protein Binding as a Two-Step Mechanism: Preselection of Encounter Poses during the Binding of BPTI and Trypsin.Biophys J. 2020 Aug 4;119(3):652-666. doi: 10.1016/j.bpj.2020.06.032. Epub 2020 Jul 10. Biophys J. 2020. PMID: 32697976 Free PMC article.
-
Dynamic recognition and linkage specificity in K63 di-ubiquitin and TAB2 NZF domain complex.Sci Rep. 2018 Nov 7;8(1):16478. doi: 10.1038/s41598-018-34605-2. Sci Rep. 2018. PMID: 30405169 Free PMC article.
-
Extended Phase-Space Methods for Enhanced Sampling in Molecular Simulations: A Review.Front Bioeng Biotechnol. 2015 Sep 3;3:125. doi: 10.3389/fbioe.2015.00125. eCollection 2015. Front Bioeng Biotechnol. 2015. PMID: 26389113 Free PMC article. Review.
-
Trans-toxin ion-sensitivity of charybdotoxin-blocked potassium-channels reveals unbinding transitional states.Elife. 2019 Jul 4;8:e46170. doi: 10.7554/eLife.46170. Elife. 2019. PMID: 31271355 Free PMC article.
References
-
- Janin J (1995) Protein-protein recognition. Prog Biophys Mol Biol 64: 145–166. - PubMed
-
- Janin J (1997) Specific versus non-specific contacts in protein crystals. Nat Struct Biol 4: 973–974. - PubMed
-
- McCammon JA (1998) Theory of biomolecular recognition. Curr Opin Struct Biol 8: 245–249. - PubMed
-
- Frauenfelder H, Sligar SG, Wolynes PG (1991) The energy landscapes and motions of proteins. Science 254: 1598–1603. - PubMed
-
- Wolynes PG, Onuchic JN, Thirumalai D (1995) Navigating the folding routes. Science 267: 1619–1620. - PubMed
Publication types
MeSH terms
Substances
LinkOut - more resources
Full Text Sources
Other Literature Sources
Miscellaneous

