. 2014 Oct 23;10(10):e1004692.
doi: 10.1371/journal.pgen.1004692. eCollection 2014 Oct.

Genetic influences on translation in yeast

Affiliations

Genetic influences on translation in yeast

Frank W Albert et al. PLoS Genet. .

Abstract

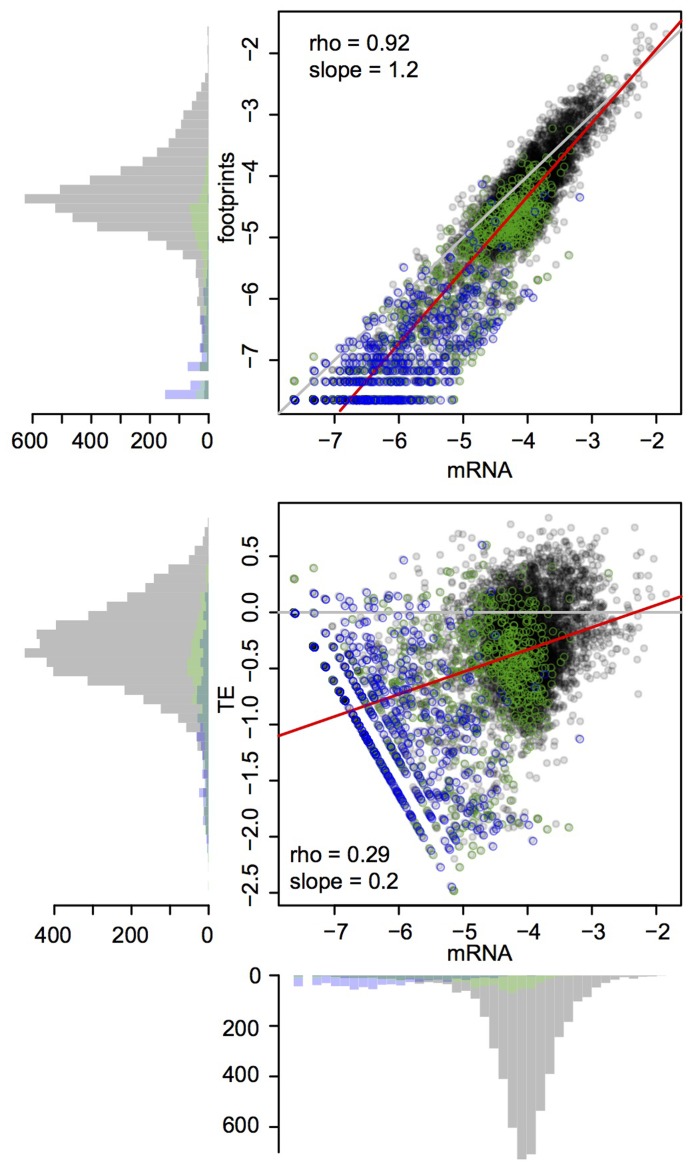
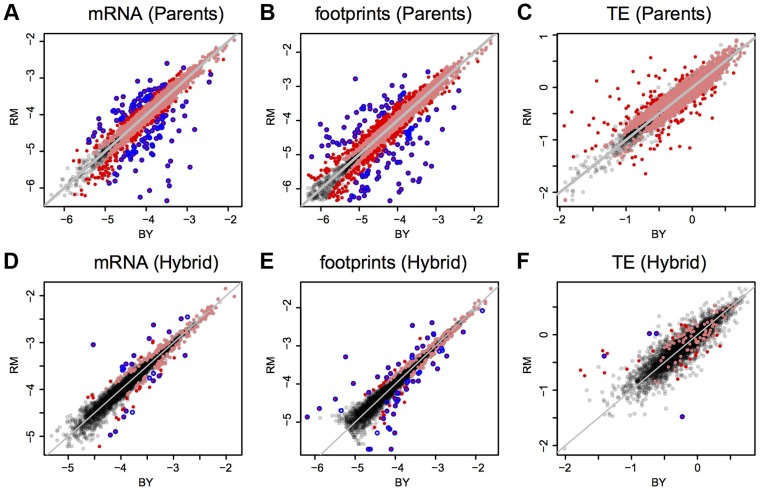
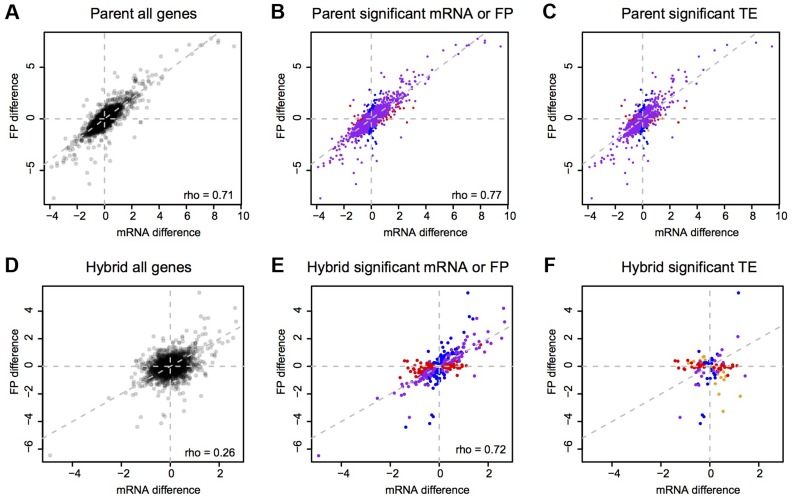
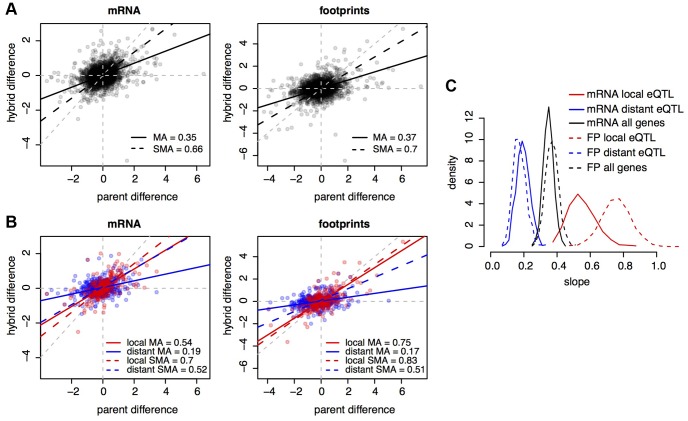
Heritable differences in gene expression between individuals are an important source of phenotypic variation. The question of how closely the effects of genetic variation on protein levels mirror those on mRNA levels remains open. Here, we addressed this question by using ribosome profiling to examine how genetic differences between two strains of the yeast S. cerevisiae affect translation. Strain differences in translation were observed for hundreds of genes. Allele specific measurements in the diploid hybrid between the two strains revealed roughly half as many cis-acting effects on translation as were observed for mRNA levels. In both the parents and the hybrid, most effects on translation were of small magnitude, such that the direction of an mRNA difference was typically reflected in a concordant footprint difference. The relative importance of cis and trans acting variation on footprint levels was similar to that for mRNA levels. There was a tendency for translation to cause larger footprint differences than expected given the respective mRNA differences. This is in contrast to translational differences between yeast species that have been reported to more often oppose than reinforce mRNA differences. Finally, we catalogued instances of premature translation termination in the two yeast strains and also found several instances where erroneous reference gene annotations lead to apparent nonsense mutations that in fact reside outside of the translated gene body. Overall, genetic influences on translation subtly modulate gene expression differences, and translation does not create strong discrepancies between genetic influences on mRNA and protein levels.


Conflict of interest statement

The authors have declared that no competing interests exist.

Figures

Figure 1
Figure 1. Global mRNA and footprint abundance.
Shown are log10-transformed normalized read counts in the BY strain. Top panel: mRNA vs. footprint abundance. The red line shows the regression of footprint on mRNA abundance. The grey line indicates identity. Bottom panel: TE as a function of mRNA abundance. The grey line denotes identity between footprint and mRNA levels (i.e. log10(TE) = 0). The red line shows the regression of TE on mRNA abundance. Throughout the figure, transparent grey points are “verified” ORFs, green points are “uncharacterized” ORFs and blue points are “dubious” ORFs.
Figure 2
Figure 2. Expression in BY vs. RM and ASE in the hybrid.
Shown are log10-transformed normalized read counts based on the downsampled data (Methods). Grey diagonal lines mark identity. Light red points are genes with significant differences (Bonferroni corrected: p<9e-6 in parent data and p<1.5 e-5 in hybrid data), darker red points are significant genes with a fold change ≥2. The blue circles denote genes that were called significant by DESeq (Benjamini-Hochberg adjusted p<0.05). A–C: parental comparisons, D–F: hybrid ASE. Note that in F) only four of the nine genes with significant TE difference identified by DESeq are shown, the remaining five had abundance too low to be included in the downsampled data (Methods).
Figure 3
Figure 3. mRNA vs. footprint differences.
Shown are log2-transformed fold changes. A–C: parents, D–F: hybrid ASE. Grey dashed lines are the diagonal. Left column: all genes. Middle column: genes with a significant (Bonferroni corrected: p<9e-6 in parent data and p<1.5 e-5 in hybrid data) mRNA (red), footprint (blue) or both mRNA and footprint (purple) difference. Right column: genes with a significant TE difference. Red: genes with only a significant mRNA difference, blue: genes with only a significant footprint difference, purple: genes with both a significant mRNA and footprint difference, orange: genes with neither a significant mRNA nor a significant footprint difference.
Figure 4
Figure 4. Cis and trans effects.
A. Parental differences (estimated based on SNP allele counts) on the x-axes, and hybrid differences on the y-axes, for all genes. Black lines show the slope of the relationship between hybrid and parental differences. The legends indicate the values of these slopes. MA: major axis estimate; SMA: standardized major axis estimate. B. as in A), but only for genes with eQTL in . Red: genes with a local but no distant eQTL, blue: genes with a distant but no local eQTL, purple: genes with both a local and a distant eQTL. Colored lines show the respective regressions of hybrid on parental differences. C. bootstrapped distributions of MA slope estimates. Results from SMA were qualitatively similar.
Figure 5
Figure 5. Relationship between mRNA differences and footprint differences within and between species.
A. Schematic representation of the possible relationships between mRNA differences and footprint differences. B. Observed distribution of all analyzed genes in three data sets. The color scheme is the same is in A), with light grey indicating genes without a TE difference. For BY/RM, significance was determined using a Bonferroni-corrected p-value of <0.05. Scer: Saccharomyces cerevisiae. Spar: Saccharomyces paradoxus. The interspecies data were analyzed from published datasets ( and [34]). C) As in B), but showing the fraction of genes with a certain relationship among genes with a significant TE difference.
Figure 6
Figure 6. Comparison of mRNA and footprint differences to pQTL effects.
For each gene, the pQTL effects are shown as the sum of allele frequency differences at all pQTL identified by a bulk segregant approach . The pQTL effect sizes shown on the x axis are identical in all four panels and are compared to A) parental mRNA differences, B) parental footprint differences, C) hybrid allele-specific mRNA differences and D) hybrid allele-specific footprint differences.
Figure 7
Figure 7. Examples of patterns of translation at putative premature stop codons.
Grey arrows indicate the position and strand of ORFs. Footprints (red) and mRNA (blue, inverted scale) for BY and RM are plotted beneath. The positions of putative premature stop codons in BY or RM are shown as light blue, longer horizontal bars, while all sequence differences between BY and RM are shown as light blue tickmarks above the ORF. The mRNA and footprint densities are shown as log transformed numbers of read starts in 30 bp wide smoothed windows. They are only shown for the strand of the displayed ORFs. A. An example of a premature translation termination in CUE2 in RM compared to BY. B. Two putative nonsense SNPs in TRM2 are in fact upstream of the translated and transcribed ORF. C. The gene NIT1 in BY is the result of a premature termination of a full length ORF that in RM includes the downstream ORF YIL165C.

References

    1. Brem RB, Yvert G, Clinton R, Kruglyak L (2002) Genetic Dissection of Transcriptional Regulation in Budding Yeast. Science (New York, NY) 296: 752–755. - PubMed
    1. Rockman MV, Kruglyak L (2006) Genetics of global gene expression. Nature Reviews Genetics 7: 862–872. - PubMed
    1. Lappalainen T, Sammeth M, Friedländer MR, Hoen PAC', Monlong J, et al. (2013) Transcriptome and genome sequencing uncovers functional variation in humans. Nature 501: 506–511. - PMC - PubMed
    1. Foss EJ, Foss EJ, Radulovic D, Radulovic D, Shaffer SA, et al. (2007) Genetic basis of proteome variation in yeast. Nature Genetics 39: 1369–1375. - PubMed
    1. Foss EJ, Radulovic D, Shaffer SA, Goodlett DR, Kruglyak L, et al. (2011) Genetic Variation Shapes Protein Networks Mainly through Non-transcriptional Mechanisms. PLoS Biology 9: e1001144 10.1371/journal.pbio.1001144.s010 - DOI - PMC - PubMed

Publication types