. 2014 Oct 23;10(10):e1004731.
doi: 10.1371/journal.pgen.1004731. eCollection 2014 Oct.

Multiple regulatory systems coordinate DNA replication with cell growth in Bacillus subtilis

Affiliations

Multiple regulatory systems coordinate DNA replication with cell growth in Bacillus subtilis

Heath Murray et al. PLoS Genet. .

Abstract

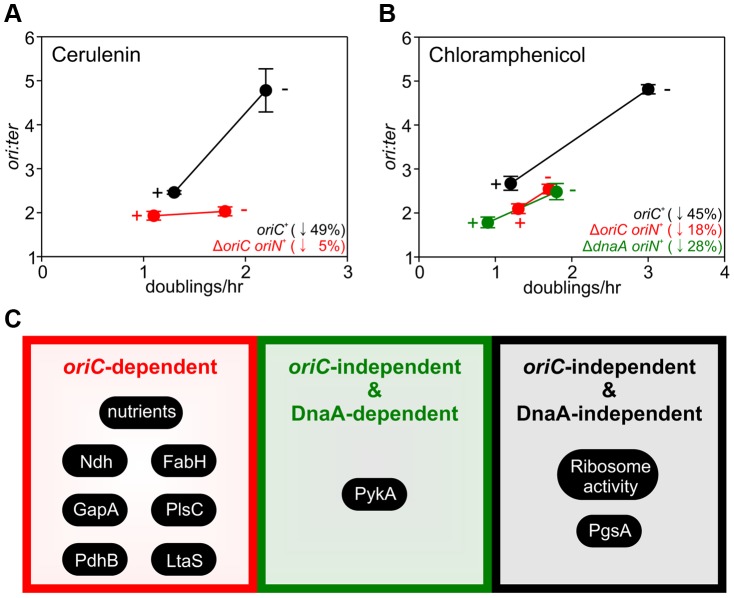
In many bacteria the rate of DNA replication is linked with cellular physiology to ensure that genome duplication is coordinated with growth. Nutrient-mediated growth rate control of DNA replication initiation has been appreciated for decades, however the mechanism(s) that connects these cell cycle activities has eluded understanding. In order to help address this fundamental question we have investigated regulation of DNA replication in the model organism Bacillus subtilis. Contrary to the prevailing view we find that changes in DnaA protein level are not sufficient to account for nutrient-mediated growth rate control of DNA replication initiation, although this regulation does require both DnaA and the endogenous replication origin. We go on to report connections between DNA replication and several essential cellular activities required for rapid bacterial growth, including respiration, central carbon metabolism, fatty acid synthesis, phospholipid synthesis, and protein synthesis. Unexpectedly, the results indicate that multiple regulatory systems are involved in coordinating DNA replication with cell physiology, with some of the regulatory systems targeting oriC while others act in a oriC-independent manner. We propose that distinct regulatory systems are utilized to control DNA replication in response to diverse physiological and chemical changes.


Conflict of interest statement

The authors have declared that no competing interests exist.

Figures

Figure 1
Figure 1. Nutrient-mediated growth rate regulation of DNA replication initiation in B. subtilis.
(A) Culturing B. subtilis in a different media generates a range of steady-state growth rates and affects the frequency of DNA replication initiation. A wild-type strain (HM222) was grown overnight at 37°C in minimal media supplemented with succinate and amino acids (20 µg/ml). The culture was diluted 1∶100 into various media to generate a range of steady-state growth rates and grown at 37°C until an A600 of 0.3–0.4. Genomic DNA was harvested from cells and marker frequency analysis was determined using qPCR. The ori:ter ratios are plotted versus growth rate (error bars indicate the standard deviation of three technical replicates). Representative data are shown from a single experiment; independently performed experiments are shown in Figures 4 and S5. (B) Culturing B. subtilis at different temperatures generates a range of steady-state growth rates but does not affect the frequency of DNA replication initiation. A wild-type strain (HM715) was grown overnight at 23°C in LB. The culture was diluted 1∶100 into LB and incubated at different temperatures to generate a range of steady-state growth rates until an A600 of 0.2–0.3. Genomic DNA was harvested from cells and marker frequency analysis was determined using qPCR. The ori:ter ratios are plotted versus growth rate (error bars indicate the standard deviation of three technical replicates). Representative data are shown from a single experiment; an independently performed replicate of the experiment is shown in Figure S1. (C) Measurement of DnaA protein levels at various growth rates in wild-type B. subtilis (HM715). Cultures were grown at 37°C overnight as in (A) and diluted 1∶100 into various media (succinate, glycerol, glycerol + amino acids, LB). to generate a range of steady-state growth rates until an A600 of 0.6–0.8. Cells were lysed and DnaA protein was detected using Western blot analysis (FtsZ protein was likewise detected and used as a loading control). For each culture media the average amount of DnaA (+/− standard deviation) from at least three biological replicates was determined using densitometry; values were normalized to LB.
Figure 2
Figure 2. Changes in DnaA protein level are not sufficient to account for nutrient-mediated growth rate regulation of DNA replication initiation in B. subtilis.
(A) The endogenous dnaA gene was placed under the control of the IPTG-inducible promoter Pspac to generate a range of DnaA protein levels. Strains were grown overnight at 37°C in minimal media supplemented with succinate and amino acids (20 µg/ml); IPTG (400 µM) and erythromycin was added to HM742. The cultures were diluted 1∶100 into various media (glycerol, glycerol + amino acids, LB) to generate a range of steady-state growth rates and grown at 37°C until an A600 of 0.5–0.6; in each medium HM742 was supplemented with erythromycin and a range of IPTG (800, 400, 200, 100, 50 µM). Cells were lysed and DnaA protein was detected using Western blot analysis (FtsZ protein was likewise detected and used as a loading control). The amount of DnaA was determined using densitometry; values were normalized to wild-type. Wild-type (HM222), Pspac-dnaA (HM742). (B) DNA replication was measured at over a range of DnaA protein levels. Strains were grown as described in (A). Genomic DNA was harvested from cells and marker frequency analysis was determined using qPCR. For each growth media, the ori:ter ratios are plotted versus IPTG concentration (error bars indicate the standard deviation of three technical replicates). Representative data are shown from a single experiment; an independently performed replicate of the experiment is shown in Figure S4A. Wild-type (HM222), Pspac-dnaA (HM742). (C) Measurement of replication origins number per cell. An array of ∼150 tetO sites was inserted near the replication origin and visualized using TetR-YFP. Strains were grown as described in (A), except that overnight cultures were only diluted into a single medium (glycerol + amino acids); AK652 was supplemented with erythromycin and a range of IPTG concentrations. Samples were taken at mid-exponential phase for microscopy and membranes were stained to identify single cells (scale bar  =  5 µm). Histogram colour corresponds to the respective strain/IPTG concentration and the average number of origins per cell is indicated (n> 300). Wild-type (AK647), Pspac-dnaA (AK652). (D) To strongly overexpress DnaA the endogenous dnaA gene was placed under the control of Pspac and an ectopic copy of dnaA was integrated at the amyE locus under the control of the xylose inducible promoter Pxyl (HM745). The strain was grown overnight at 37°C in minimal media supplemented with glycerol, amino acids (20 µg/ml), IPTG (800 µM), and erythromycin. The culture was diluted 1∶100 into media containing IPTG (800 µM), erythromycin, either glycerol minimal media supplemented with a range of xylose (1, 0.5, 0.25, 0.125, 0.063, 0.031, 0.016, 0.008, 0.004, 0%) or LB, and grown at 37°C until an A600 of 0.2–0.4. Genomic DNA was harvested from cells and marker frequency analysis was determined using qPCR. For each growth media, the ori:ter ratios are plotted versus xylose concentration (error bars indicate the standard deviation of three technical replicates). Representative data are shown from a single experiment; an independently performed replicate of the experiment is shown in Figure S4B. (E) HM745 was grown as described in (D) until cultures reached an A600 of 0.6–0.9, cells were lysed, and DnaA protein was detected using Western blot analysis (FtsZ protein was likewise detected and used as a loading control). The open arrowhead highlights that overexpressed DnaA ran as a doublet (similar results have been observed for other overexpressed proteins in B. subtilis; HM). For each condition the average amount of DnaA (+/− standard deviation) from three biological replicates was determined using densitometry; values were normalized to the cultures without xylose.
Figure 3
Figure 3. Nutrient-mediated growth rate regulation of DNA replication initiation is independent of Soj, YabA, and (p)ppGpp.
(A) Growth rate regulation of DNA replication initiation is maintained in either Δsoj or ΔyabA mutants. Strains were grown overnight at 37°C in minimal media supplemented with succinate and amino acids (20 µg/ml). The culture was diluted 1∶100 into various media (succinate, glycerol, glycerol + amino acids, LB) to generate a range of steady-state growth rates and grown at 37°C until an A600 of 0.3–0.4. Genomic DNA was harvested from cells and marker frequency analysis was determined using qPCR. The ori:ter ratios are plotted versus growth rate (error bars indicate the standard deviation of three technical replicates). Representative data are shown from a single experiment; an independently performed replicate of the experiment is shown in Figures S5A-B. Wild-type (HM222), Δsoj (HM227), ΔyabA (HM739), Δsoj ΔyabA (HM741). (B) Growth rate regulation of DNA replication initiation does not require (p)ppGpp. Strains were grown overnight at 37°C in minimal media supplemented with succinate and amino acids (200 µg/ml). The culture was diluted 1∶100 into various media (succinate + amino acids, glycerol + amino acids, LB, PAB) to generate a range of steady-state growth rates and grown at 37°C until an A600 of 0.2–0.6. Genomic DNA was harvested from cells and marker frequency analysis was determined using qPCR. The ori:ter ratios are plotted versus growth rate (error bars indicate the standard deviation of three technical replicates). Representative data are shown from a single experiment; an independently performed experiment is shown in Figure S5C. Wild-type (HM222), Δ(p)ppGpp (HM1230).
Figure 4
Figure 4. Nutrient-mediated growth rate regulation of DNA replication initiation requires oriC and DnaA.
(A) oriC is required for growth rate regulation of DNA replication initiation. Strains were grown overnight at 37°C in minimal media supplemented with succinate and amino acids (20 µg/ml). The culture was diluted 1∶100 into various media (succinate, glycerol, glycerol + amino acids, LB, PAB) to generate a range of steady-state growth rates and grown at 37°C until an A600 of 0.3–0.4. Genomic DNA was harvested from cells and marker frequency analysis was determined using qPCR. The ori:ter ratios are plotted versus growth rate (error bars indicate the standard deviation of three technical replicates). Representative data are shown from a single experiment; an independently performed replicate of the experiment is shown in Figure S6A. Wild-type (HM222), ΔoriC oriN+ (HM228). (B) Integration of oriN into the B. subtilis chromosome does not eliminate growth rate regulation of DNA replication initiation. Strains were grown as in (A) and the overnight culture was diluted 1∶100 into various media (succinate, glycerol, glycerol + amino acids, LB). Genomic DNA was harvested from cells and marker frequency analysis was determined using qPCR. The ori:ter ratios are plotted versus growth rate (error bars indicate the standard deviation of three technical replicates). Representative data are shown from a single experiment; an independently performed replicate of the experiment is shown in Figure S6B. Wild-type (HM715), oriC + oriN+ (HM949). (C) DnaA activity is required for growth rate regulation of DNA replication initiation. Strains were grown as in (B). Genomic DNA was harvested from cells and marker frequency analysis was determined using qPCR. The ori:ter ratios are plotted versus growth rate (error bars indicate the standard deviation of three technical replicates). Representative data are shown from a single experiment; an independently performed replicate of the experiment is shown in Figure S6C. Wild-type (HM715), DnaAR264A oriN+ (HM1122). (D) Measurement of DnaA protein levels at various growth rates in a ΔoriC oriN+ strain (HM950). Cultures were grown as described in (B). Cells were lysed and DnaA protein was detected using Western blot analysis (FtsZ protein was likewise detected and used as a loading control). For each culture media the average amount of DnaA (+/− standard deviation) from at least three biological replicates was determined using densitometry; values were normalized to LB. (E) Subcellular localization of DNA over a range of growth rates in the wild-type (HM715) and ΔoriC oriN+ (HM950) strains. Cells were grown as in (B) and the overnight culture was diluted 1∶100 into various media (succinate, glycerol, or glucose + amino acids). Samples were taken at an A600 of 0.3–0.5 at which point membranes and DNA were stained. Arrows indicate cells without DNA and asterisks indicate space within the cell that does not contain DNA. Scale bar represents 3 µm.
Figure 5
Figure 5. Analysis of oriC-dependent growth rate regulation through genetic targeting of essential cellular activities.
Strains were grown overnight at 37°C in LB medium; strains harbouring plasmids integrated into the genome by single-crossover were supplemented with appropriate antibiotics and inducer (0.1 mM IPTG or 0.1% xylose). Overnight cultures were diluted 1∶1000 into fresh LB medium and grown at 37°C until they reached an A600 of 0.3–0.5; strains harbouring plasmids integrated by single-crossover were supplemented with appropriate antibiotics either without or with the appropriate inducer (1 mM IPTG or 1% xylose). For datapoints “+” indicates the presence of either the wild-type gene (when comparing with knockout mutants) or the inducer; “−” indicates the absence of either the gene (when comparing with wild-type) or the inducer. Genomic DNA was harvested from cells and marker frequency analysis was determined using qPCR. The ori:ter ratios are plotted versus growth rate and the percentage change in the ori:ter ratios comparing each deletion/depletion is indicated (error bars indicate the standard deviation of three technical replicates). Representative data are shown from a single experiment; an independently performed replicate of the experiment is shown in Figure S7. (A) Wild-type (HM715), Δndh (HM1318), ΔoriC oriN+ (HM957), Δndh ΔoriC oriN+ (HM1319); (B) Pspac-gapA (HM1208), Pspac-gapA ΔoriC oriN+ (HM1221); (C) Cultures were supplemented with 0.2% sodium acetate. Wild-type (HM715), ΔpdhB (HM1248), ΔoriC oriN+ (HM950), ΔpdhB ΔoriC oriN+ (HM1266); (D) Pspac-fabHA (HM964), Pspac-fabHA ΔoriC oriN+ (HM966); (E) Pxyl-plsC (HM1080), Pxyl-plsC ΔoriC oriN+ (HM1086); (F) Wild-type (HM715), ΔltaS (HM1168), ΔoriC oriN+ (HM957), ΔltaS ΔoriC oriN+ (HM1244).
Figure 6
Figure 6. Analysis of oriC-independent growth rate regulation through genetic targeting of essential cellular activities.
Strains were grown and data presented as described for Figure 5, except that the depletion of PgsA required supplementation with 1 mM IPTG to overexpress the xylose repressor. The ori:ter ratios are plotted versus growth rate and the percentage change in the ori:ter ratios comparing each deletion/depletion is indicated (error bars indicate the standard deviation of three technical replicates). Representative data are shown from a single experiment; an independently performed replicate of the experiment is shown in Figure S8. (A) Pspac-pykA (HM1176), Pspac-pykA ΔoriC oriN+ (HM1186); (B) Pxyl-pgsA (HM1365), Pxyl-pgsA ΔoriC oriN+ (HM1374); (C) Wild-type (HM715), ΔrpsU (HM1150), ΔrplA (HM1151), ΔrplW (HM1152), ΔrpmJ (HM1154), ΔoriC oriN+ (HM950), ΔrpsU ΔoriC oriN+ (HM1156), ΔrplA ΔoriC oriN+ (HM1157), ΔrplW ΔoriC oriN+ (HM1158), ΔrpmJ ΔoriC oriN+ (HM1160). (D) Pspac-pykA (HM1176), Pspac-pykA ΔdnaA oriN+ (HM1425); (E) Pxyl-pgsA (HM1365), Pxyl-pgsA ΔdnaA oriN+ (HM1433); (F) Wild-type (HM715), ΔrpsU (HM1150), ΔrplA (HM1151), ΔrpmJ (HM1154), ΔdnaA oriN+ (HM1423), ΔrpsU ΔdnaA oriN+ (HM1429), ΔrplA ΔdnaA oriN+ (HM1430), ΔrpmJ ΔdnaA oriN+ (HM1432).
Figure 7
Figure 7. Analysis of oriC-dependent and oriC-independent growth rate regulation through small molecule targeting of fatty acid synthesis and protein synthesis.
Strains were grown overnight at 37°C in LB medium. Overnight cultures were diluted 1∶1000 into fresh LB medium either without or with antibiotics (2 µg/ml cerulenin (A), 1 µg/ml chloramphenicol (B)) and grown at 37°C until they reached an A600 of 0.3–0.5. For datapoints “+” indicates the presence of the small molecule inhibitor and “−” indicates the absence. Genomic DNA was harvested from cells and marker frequency analysis was determined using qPCR. The ori:ter ratios are plotted versus growth rate and the percentage change in the ori:ter ratios comparing each deletion/depletion is indicated (error bars indicate the standard deviation of three technical replicates). Representative data are shown from a single experiment; an independently performed replicate of the experiment is shown in Figure S9. Wild-type (HM715), ΔoriC oriN+ (HM950), ΔdnaA oriN+ (HM1423). (C) Summary of growth rate control systems affecting DNA replication described in this report.

Similar articles

Cited by

References

    1. Cooper S, Helmstetter CE (1968) Chromosome replication and the division cycle of Escherichia coli B/r. J Mol Biol 31: 519–540. - PubMed
    1. Helmstetter CE, Cooper S (1968) DNA synthesis during the division cycle of rapidly growing Escherichia coli B/r. J Mol Biol 31: 507–518. - PubMed
    1. Schaechter M, Maaloe O, Kjelgaard NO (1958) Dependency on medium and temperature on cell size and chemical coposition during balanced growth of Salmonella typhimurium . J Gen Microbiol 19: 592–606. - PubMed
    1. Donachie WD (1968) Relationship between cell size and time of initiation of DNA replication. Nature 219: 1077–1079. - PubMed
    1. Wold S, Skarstad K, Steen HB, Stokke T, Boye E (1994) The initiation mass for DNA replication in Escherichia coli K-12 is dependent on growth rate. EMBO J 13: 2097–2102. - PMC - PubMed

Publication types

MeSH terms

LinkOut - more resources