. 2014 Oct 23;514(7523):498-502.
doi: 10.1038/nature13814.

Dendritic cells control fibroblastic reticular network tension and lymph node expansion

Affiliations

Dendritic cells control fibroblastic reticular network tension and lymph node expansion

Sophie E Acton et al. Nature. .

Abstract

After immunogenic challenge, infiltrating and dividing lymphocytes markedly increase lymph node cellularity, leading to organ expansion. Here we report that the physical elasticity of lymph nodes is maintained in part by podoplanin (PDPN) signalling in stromal fibroblastic reticular cells (FRCs) and its modulation by CLEC-2 expressed on dendritic cells. We show in mouse cells that PDPN induces actomyosin contractility in FRCs via activation of RhoA/C and downstream Rho-associated protein kinase (ROCK). Engagement by CLEC-2 causes PDPN clustering and rapidly uncouples PDPN from RhoA/C activation, relaxing the actomyosin cytoskeleton and permitting FRC stretching. Notably, administration of CLEC-2 protein to immunized mice augments lymph node expansion. In contrast, lymph node expansion is significantly constrained in mice selectively lacking CLEC-2 expression in dendritic cells. Thus, the same dendritic cells that initiate immunity by presenting antigens to T lymphocytes also initiate remodelling of lymph nodes by delivering CLEC-2 to FRCs. CLEC-2 modulation of PDPN signalling permits FRC network stretching and allows for the rapid lymph node expansion--driven by lymphocyte influx and proliferation--that is the critical hallmark of adaptive immunity.


Figures
Extended data Figure 1
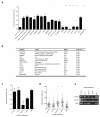
Extended data Figure 1. Screen for inhibitors of PDPN-mediated cell contractility
a) Quantification of proportion of contracted NIH/3T3 fibroblasts expressing eGFP control or PDPN-CFP and treated with the indicated inhibitors or vehicles. Statistically significant inhibition: **** p <0.00001 and * p = 0.01, Fisher’s Exact test. Data represent mean ± SD of 3 independent experiments. b) Chemical inhibitors used in (a) and their targets. c) Contraction score of PDPN-expressing NIH/3T3 fibroblasts transfected with siRNA smartpools targetting the indicated Rho GEFs (MU-046870-01-0002, MU-040120-00-0002, MU-047092-01-0002, MU-041056-01-0002, Dharmacon, GE Healthcare). **, p<0.05, one-way ANOVA. d) Maximum length of FRCs in collagen gels measured in 3-dimensions from 100 μm deep confocal z-stacks. Each point represents one FRC. **, p<0.05, one-way ANOVA. e) PCR analysis of RhoGEF mRNA expression in FRC cell lines following siRNA knockdown in comparison to expression of GAPDH.
Extended data Figure 2
Extended data Figure 2. Generation of FRC lines
Comparison of an FRC cell line generated by immortalisation of primary FRCs (bottom panels, blue) with primary FRCs in LN cell suspensions cultured for 7 days (top panels, red). Gray histograms indicate isotype-matched control antibody staining. Histograms of primary LN cultures are gated on CD45 CD140a+ cells to exclude haematopoietic cells and other stromal subsets. Histograms of the FRC cell line are gated only on live cells.
Extended data Figure 3
Extended data Figure 3. Loss of PDPN results in FRC spreading and actin polymerisation
a) Single optical slice (1 μm) showing morphology and pMLC organisation of control and PDPN KD FRCs. pMLC S(19) (green), F-actin (red). Scale bar indicates 50 μm b) Quantification of the number of ARP2/3 positive protrusions per FRC comparing control (green) and PDPN KD (red) cell lines. Data represent mean +/−SD, each point represents an individual FRC. p<0.0001 calculated using Mann Whitney U test. c) Quantification of tail retraction defects comparing control and PDPN KD FRCs. Data are collated from >100 cells, p<0.0001 calculated using Fisher’s exact test. “Present” means that tail retraction defects were deemed present by the observer.
Extended data Figure 4
Extended data Figure 4. Loss of pMLC and F-actin filaments following treatment of FRCs with CLEC-2
Single optical slices (1 μm) of FRC cell lines treated for 30 min with 10 μg/ml soluble CLEC-2-Fc protein, fixed and stained for pMLC (S19) (green) and F-actin (red). Scale bar represents 50 μm. Higher magnification shown in right hand panels. Scale bar represents 5 μm.
Extended data Figure 5
Extended data Figure 5. Elongated morphology of CLEC-2-treated FRCs in 3D cultures
Quantification of maximum cell length for 100 μm deep z-stacks. FRCs cultured in 3D collagen/matrigel matrix for 3 days treated with CLEC-2-Fc, ROCK inhibitor 10 μM (Y27632), or stably knocked down for PDPN expression. Left panel shows projection of the 3D stack; staining F-actin (red), DNA (cell nuclei, blue). Scale bar indicates 200 μm. Centre panel shows x,y,z coordinates and length of each vector for each end of each cell in 3D as quantified using Imaris image analysis software. Right panel shows example of cell morphology in each treatment group; staining F-actin (red), DNA (cell nuclei, blue). Scale bar indicates 50 μm.
Extended data Figure 6
Extended data Figure 6. Timecourse of LN expansion following OVA/CFA immunisation
Total cellularity, number of T cells (CD45+, CD3+), B cells (CD45+, CD19+) and BEC (CD45 PDPN CD31+) in draining LNs at different times after OVA/CFA immunisation. Each point represents one lymph node and data show mean ± SD of 2 independent experiments scoring 8-12 mice. Day 0 represents LNs from non-immunised mice. Asterisks represent statistically significant differences between non-immunised and immunised mice as calculated using 1-way ANOVA test followed by Tukey’s multiple comparisons test (*, p<0.05, **, p>0.001, ***, p>0.0001, ****, p<0.00001).
Extended data Figure 7
Extended data Figure 7. FRCs are selectively labelled in PDGFRαKI H2B-GFP mice
a) Analysis of skin draining LNs from PDGFRαKI H2B-GFP mice showing lymph node stromal cells co-expressing CD140a (PDGFRa) and GFP. Left panel shows gate for CD45 stroma, right panel shows GFP and CD140a expression of CD45 gate. b) Flow cytometry analysis showing that GFP+ cells are CD140a+. Left panel shows gating for GFP+ LN cells, right panel shows CD140a expression of GFP+ gate (green) compared to CD45 cells (gray) c) Z-stack of PDGFRαKI H2B-GFP lymph node imaged ex vivo using 2-photon microscopy. FRC nuclei (green), second harmonic signal (collagen) (blue). Wheat germ agglutinin AF647 (red) was injected subcutaneously 5 minutes prior to LN extraction to label conduits. Scale bar indicates 200 μm. d) Immunohistochemical staining of paraffin embedded sections of LNs from PDGFRαKI H2B-GFP mice. Staining GFP (brown) and PDPN (pink), counterstained with haematoxylin (blue).
Extended data Figure 8
Extended data Figure 8. Generation and characterisation of CD11cΔCLEC-2 mice
a) Scheme of targeting approach to allow conditional deletion of Clec1b exons 2,3, and 4. loxP sites shown in yellow. b) Clec1b mRNA in LPS-treated BMDC or freshly isolated CD11c+ splenocytes from CD11cΔCLEC-2 mice and Creneg littermates. Data are represented as relative expression compared to control and depict mean ± SD from 6 replicates from 2 independent experiments. p values calculated using Students’s t test. c) Quantification of bone marrow derived DC morphology cultured in contact with FRCs. Data indicate score of perimeter2/4πarea, area and perimeter calculated from immunofluorescence imaging using ImageJ software. Higher scores indicate increased elongation and/or protrusions. p=0.0007 calculated using Mann Whitney U test. d) Representative images from (c) showing DCs spreading over FRCs. F-actin (red), cell nuclei (blue). e) Total DC numbers and f) total FRC numbers in steady state skin-draining LNs of control vs CD11cΔCLEC-2 mice. Each data point represents one lymph node. g) PDPN surface expression by FRC from control and CD11cΔCLEC-2 mice as measured by flow cytometry and represented relative to the control group. MFI, mean fluorescence intensity.
Figure 1
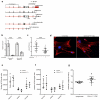
Figure 1. CLEC-2 binding uncouples PDPN from RhoA/C- and actomyosin-driven fibroblast contractility
a) NIH/3T3 expressing PDPN-CFP (blue) or untransfected (control), fixed and stained for pERM (green) or pMLC (S19) (green) and F-actin (red). Scale bar 20 μm. b) Frequency of contracting NIH/3T3 expressing PDPN-cherry or PDPN-cherry and Ezrin T567A-GFP. c) NIH/3T3 expressing PDPN-CFP (green) stained F-actin (red) treated with 10 μg/ml CLEC-2-Fc (15 min). Scale bar 50 μm. Quantification in the right panel depicts mean ± SD of 3 experiments (>300 cells). Fisher’s exact test (****, p< 0.00005, ***, p< 0.0005). d) NIH/3T3 expressing PDPN-CFP and Ezrin-mCherry treated with 10 μg/ml CLEC-2-Fc (15 min). Single optical slice (1 μm), scale bar 20 μm. Pixel colocalisation analysis is shown at bottom. e) FRC cell lines expressing RhoA or Rac1 FRET biosensors exposed to CLEC-2-Fc-coated beads. Quantification of FRET ratio is shown on right and depicts mean ± SD of 15 cells from 2 independent experiments. f) Left: total and GTP-bound Rac-1 in lysates from FRCs treated with 10 μg/ml CLEC-2-Fc (30 min). Right: same analysis in two independent PDPN-knockdown FRC lines (KD1 and KD2) vs. control line. g) FRC cell lines expressing GFP-MLC (grayscale) treated with CLEC-2-Fc-coated beads.
Figure 2
Figure 2. CLEC-2 binding causes redistribution of PDPN within the plasma membrane
a) NIH/3T3 expressing V5 tagged-PDPN mutants (PDPN-V5) stained for V5 (green) and F-actin (red). Scale bar 50 μm. b) Contraction score of NIH/3T3 expressing WT or mutant PDPN treated with 10 μM ROCK inhibitor (Y27632) (6 hours) or 10 μg/ml CLEC-2-Fc (30 min). Mean ± SD of 3 independent experiments (>300 cells). Fisher’s exact test (****, p<0.00005). c) Surface expression of PDPN and CD44 in the indicated cells as analysed by flow cytometry d) Contraction score of NIH/3T3 expressing PDPN-V5 ± CD44-GFP. Mean ± SD of 3 experiments (>150 cells). Fisher’s exact test (p<0.05). e) Confocal slices (0.5 μm) showing surface staining of lipid rafts and PDPN on primary FRCs treated with 10 μg/ml CLEC-2-Fc protein (45 min). Scale bar 50 μm. Colocalisation correlation coefficient R is shown on right; each point represents one cell. Mann Whitney U test (****, p<0.0001). f) Left: FRC cell lines treated with 250 μM MβCD (6 hours) stained for F-actin (red) and DNA (blue). Scale bar 50 μm. Right: contraction score in the indicated FRC cell lines treated with MβCD. Mean ± SD of 3 experiments >300 cells. Fisher’s exact test (****, p< 0.00005). g) Contraction score in PDPN-CFP-expressing NIH/3T3 pretreated with 250 μM MβCD (6 hours) and subsequently treated with 10 μg/ml CLEC-2-Fc (15 min). Mean ± SD of 3 experiments (>300 cells). Fisher’s exact test (****, p< 0.00005).
Figure 3
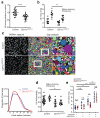
Figure 3. The FRC network stretches to accommodate acute increases in LN cellularity
a) Collagen matrix contraction by FRC cell lines treated with 10 μg/ml CLEC-2-Fc, anti-PDPN antibody or stably depleted of PDPN. Representative image is shown above. Mean ± SD 8 replicates from 2 experiments. 1-way ANOVA, Dunnetts multiple comparisons (***, p<0.0001, ****, p<0.00001) b) Maximum 3-dimensional length from cells as in (a) calculated from 100 μm confocal z-stacks. Graphs indicate median, 25th and 75th percentiles (Range 10-90 percentile). 2 independent experiments (>80 cells). 1-way ANOVA, Dunnetts multiple comparisons (*, p<0.05, ****, p<0.00001). c) LN mass, number of migratory DCs (CD45+ CD11c+ MHCIIhi) and number of FRCs (CD45 PDPN+ CD31) in LNs draining the site of OVA/CFA immunisation. Each point represents one LN. Mean ± SD 2 experiments with 8-12 mice per timepoint. Day 0 represents non-immunised mice. 1-way ANOVA, Tukey’s multiple comparisons (*, p<0.05, **, p>0.001, ***, p>0.0001, ****, p<0.00001). d) Forward scatter of FRCs following OVA/CFA immunisation (day 6). Mann Whitney U test (**, p< 0.001). e) ER-TR7 staining (green) of the T cell zone of draining or non-draining LNs following OVA/CFA immunisation (day 6). Scale bar 30 μm. f) Left: PDPN staining (white) of LN sections as in (e) converted to binary images for gap analysis. Scale bar 100 μm. Right: Gaps (coloured circles) within the FRC network. White box = area at higher magnification. Quantification is shown on far right. p = 4.194e-09 (proportion of radii> 15 μm), Fisher’s exact test. g) Morphometric analysis of GFP+ nuclei (FRCs) in draining or non-draining LN sections from PDGFRaKI-H2B-GFP mice following CFA/OVA immunisation (day 6) (left). anti-GFP (brown), hematoxylin (blue). Quantification of average area occupied by individual FRCs is shown on right. Data in f and g are from multiple sections from 8 mice in 2 independent experiments. Mann Whitney U test (****, p< 0.00001).
Figure 4
Figure 4. CLEC-2+ dendritic cells are required for LN swelling during adaptive immune responses
a) Mass of skin draining LNs from CD11cΔCLEC-2 mice and Creneg littermate controls, >24 weeks old. Data are normalised to average LN mass of Creneg control. Each data point represents 1 LN. Mann Whitney U test (****, p< 0.00001). b) LN mass (mg) of draining and non-draining LNs from 8-12 week old CD11cΔCLEC-2 mice and Creneg littermates (control) immunised with OVA/CFA (day 7). Each point represents a LN. Data from 3 experiments. 2-way ANOVA, Tukey’s multiple comparisons (**, p< 0.001). c) Gap analysis of draining LNs from immunised control (top) and CD11cΔCLEC-2 mice (bottom), quantified on the right. p = 0.0001759 (radii> 8 μm), Fisher’s exact test. d) LN deformation following compression of whole LNs with 1.4N force. Each point represents one LN. p<0.05, 1-way ANOVA. e) LN mass of CD11cΔCLEC-2 mice and Creneg littermates (control) 7 days following CFA/OVA immunisation and treatment with 10 μg CLEC-2-Fc or PBS (days 1 and 3). Each point represents one LN, data from 3 experiments. 2-way ANOVA, Tukey’s multiple comparisons test (**, p< 0.001; ***, p< 0.0001; n.s., non-significant).

Comment in

  • Physiology: Relax and come in.
    Vaahtomeri K, Sixt M. Vaahtomeri K, et al. Nature. 2014 Oct 23;514(7523):441-2. doi: 10.1038/514441a. Nature. 2014. PMID: 25341781 No abstract available.

References

    1. Girard J-P, Moussion C, Förster R. HEVs, lymphatics and homeostatic immune cell trafficking in lymph nodes. Nat Rev Immunol. 2012;12:762–773. - PubMed
    1. Junt T, Scandella E, Ludewig B. Form follows function: lymphoid tissue microarchitecture in antimicrobial immune defence. Nat Rev Immunol. 2008;8:764–775. - PubMed
    1. Banchereau J, Steinman RM. Dendritic cells and the control of immunity. Nature. 1998;392:245–252. - PubMed
    1. Link A, et al. Fibroblastic reticular cells in lymph nodes regulate the homeostasis of naive T cells. Nat. Immunol. 2007;8:1255–1265. - PubMed
    1. Katakai T. A novel reticular stromal structure in lymph node cortex: an immuno-platform for interactions among dendritic cells, T cells and B cells. International Immunology. 2004;16:1133–1142. - PubMed

Publication types

MeSH terms