

Heme oxygenase-2 deletion impairs macrophage function: implication in wound healing
- PMID: 25342128
- PMCID: PMC4285548
- DOI: 10.1096/fj.14-256503
Heme oxygenase-2 deletion impairs macrophage function: implication in wound healing
Abstract
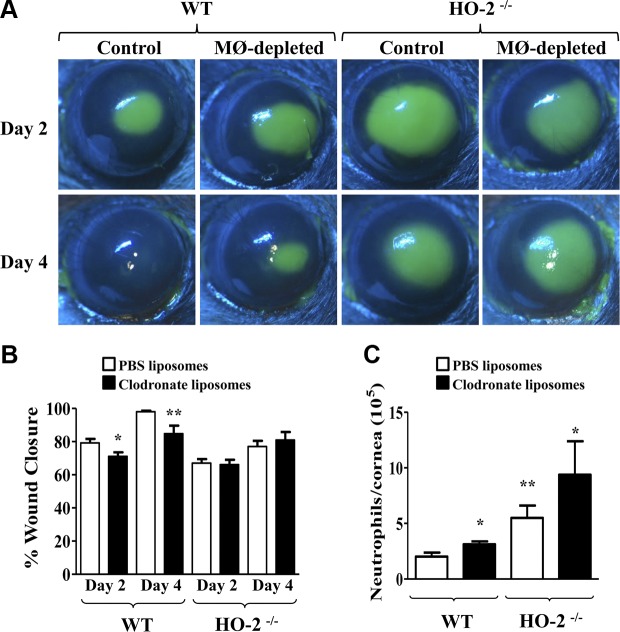
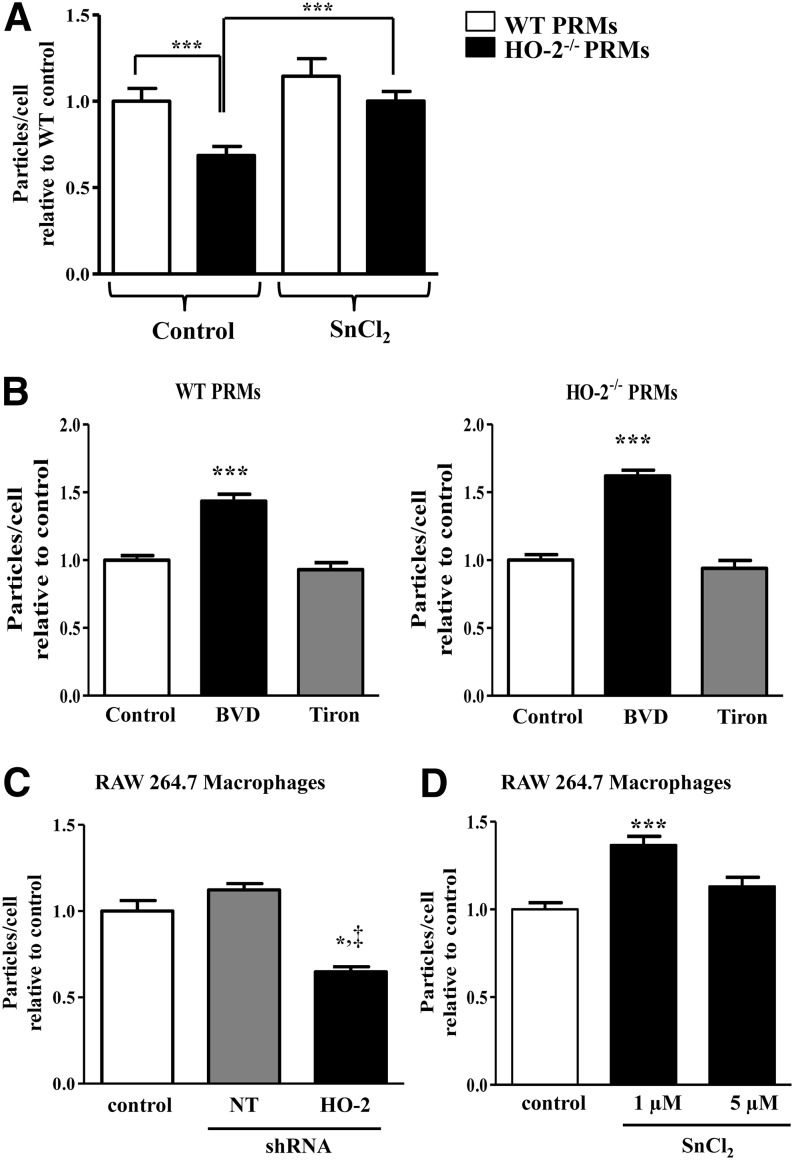
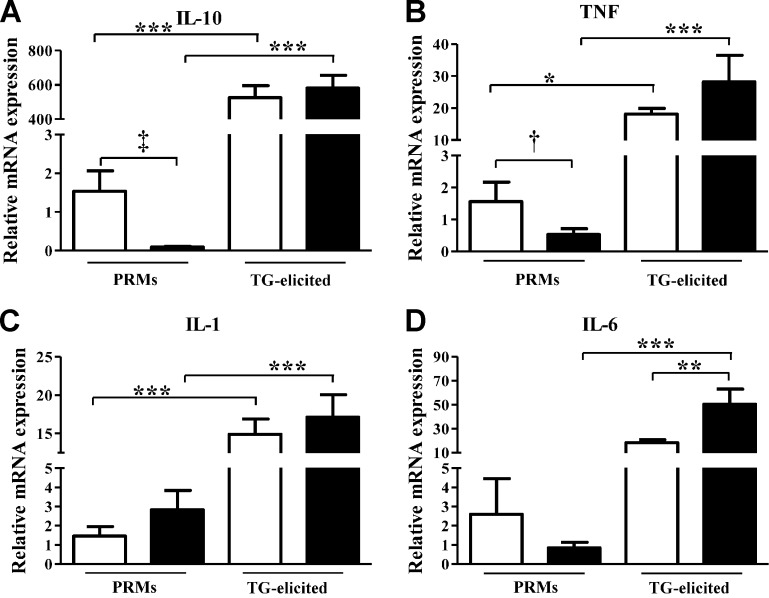
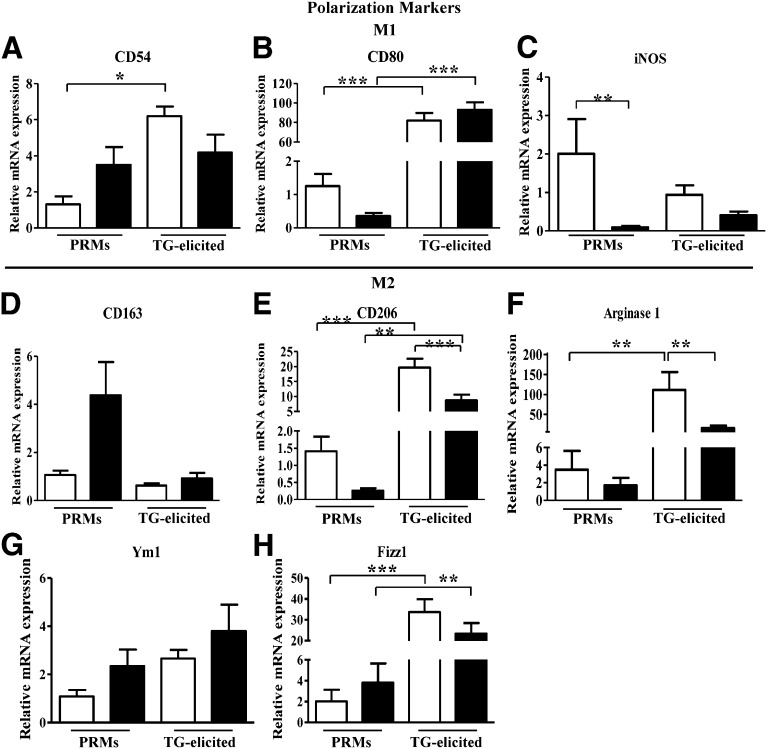
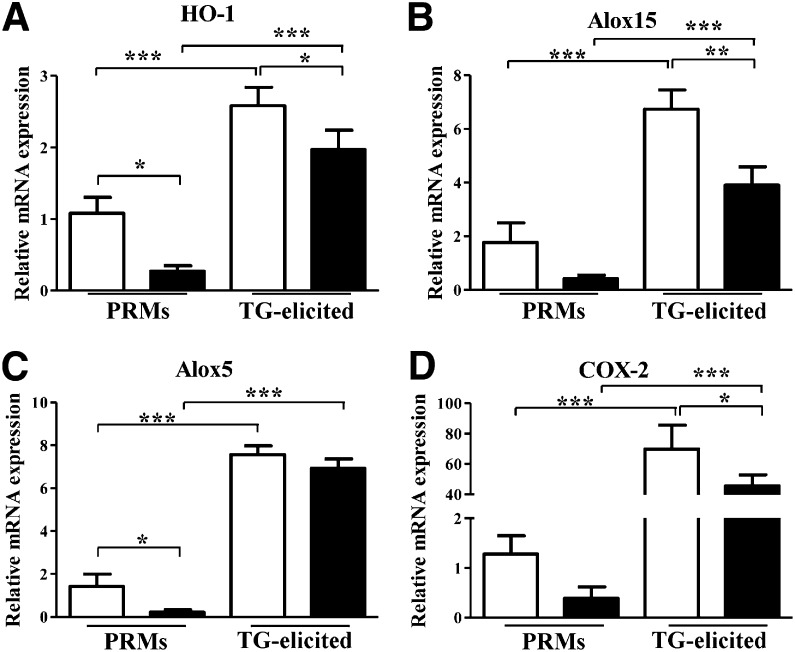
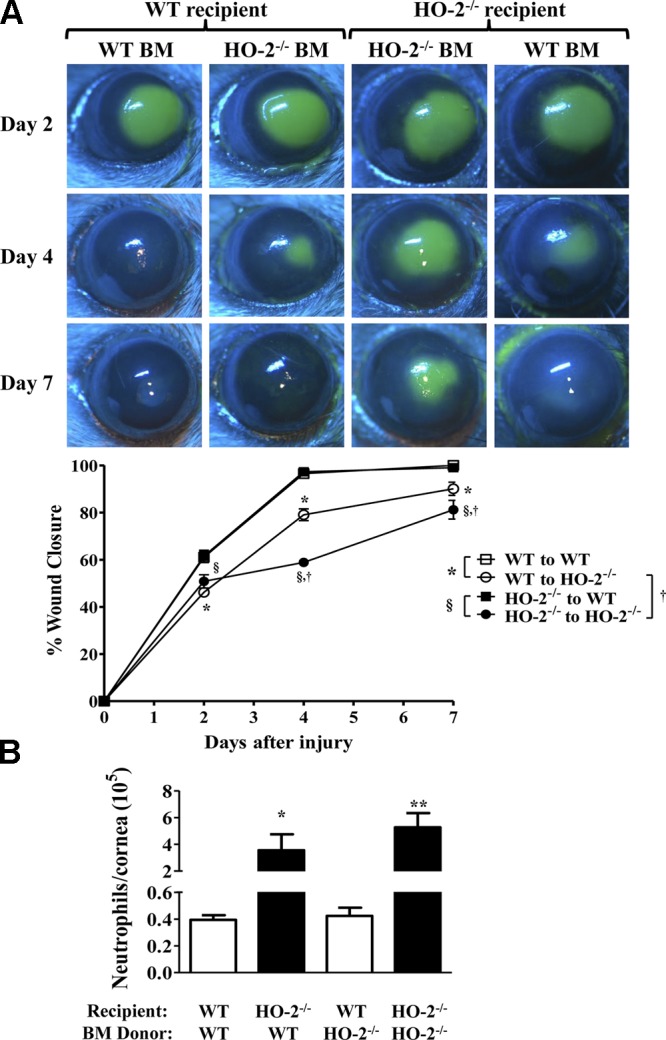
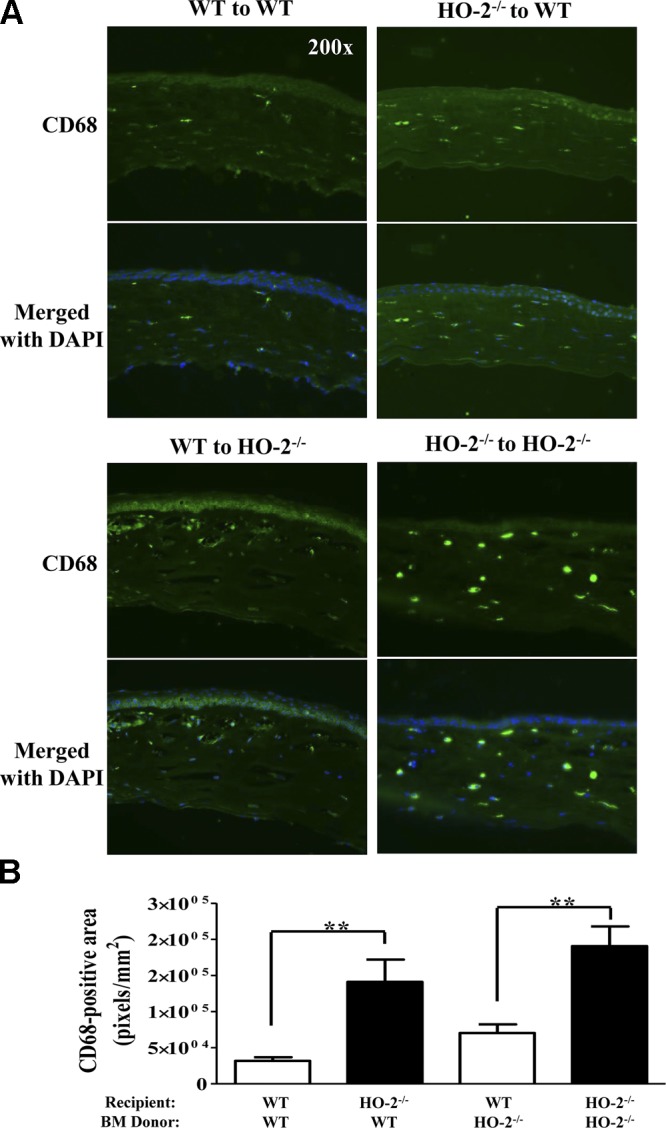
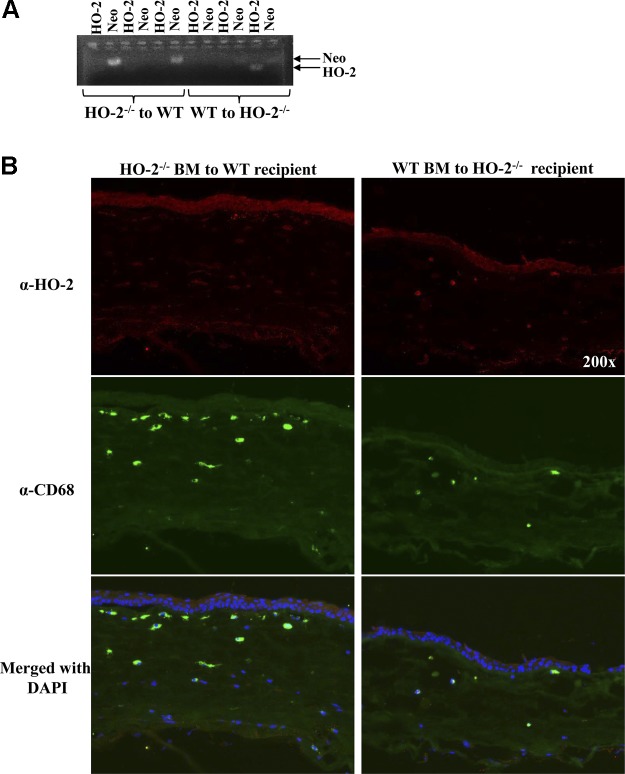
Heme oxygenase (HO)-2 deficiency impairs wound healing and exacerbates inflammation following injury. We examine the impact of HO-2 deficiency on macrophage function and the contribution of macrophage HO-2 to inflammatory and repair responses to injury. Corneal epithelial debridement was performed in control and macrophage-depleted HO-2(-/-) and wild-type (WT) mice and in bone marrow chimeras. Peritoneal macrophages were collected for determination of phagocytic activity and classically activated macrophage (M1)-alternatively activated macrophage (M2) polarization. Depletion of macrophages delayed corneal healing (13.2%) and increased neutrophil infiltration (54.1%) by day 4 in WT mice, whereas in HO-2(-/-) mice, it did not worsen the already impaired wound healing and exacerbated inflammation. HO-2(-/-) macrophages displayed an altered M1 phenotype with no significant expression of M2 or M2-like activated cells and a 31.3% reduction in phagocytic capacity that was restored by inducing HO-1 activity or supplementing biliverdin. Macrophage depletion had no effect, whereas adoptive transfer of WT bone marrow improved wound healing (34% on day 4) but did not resolve the exaggerated inflammatory response in HO-2(-/-) mice. These findings indicate that HO-2-deficient macrophages are dysfunctional and that macrophage HO-2 is required for proper macrophage function but is insufficient to correct the impaired healing of the HO-2(-/-) cornea, suggesting that corneal epithelial expression of HO-2 is a key to resolution and repair in wound healing.
Keywords: bone marrow transfer; clodronate liposomes; inflammation.
© FASEB.
Figures
Similar articles
-
The role of neutrophils in corneal wound healing in HO-2 null mice.PLoS One. 2011;6(6):e21180. doi: 10.1371/journal.pone.0021180. Epub 2011 Jun 17. PLoS One. 2011. PMID: 21695050 Free PMC article.
-
Knockdown of heme oxygenase-2 impairs corneal epithelial cell wound healing.J Cell Physiol. 2011 Jul;226(7):1732-40. doi: 10.1002/jcp.22502. J Cell Physiol. 2011. PMID: 21506105 Free PMC article.
-
Macrophage-derived heme-oxygenase-1: expression, regulation, and possible functions in skin repair.Mol Med. 2001 Jul;7(7):488-98. Mol Med. 2001. PMID: 11683374 Free PMC article.
-
M1/M2 Macrophages in Diabetic Nephropathy: Nrf2/HO-1 as Therapeutic Targets.Curr Pharm Des. 2018;24(20):2241-2249. doi: 10.2174/1381612824666180716163845. Curr Pharm Des. 2018. PMID: 30014796 Review.
-
Heme oxygenase-1 and anti-inflammatory M2 macrophages.Arch Biochem Biophys. 2014 Dec 15;564:83-8. doi: 10.1016/j.abb.2014.09.005. Epub 2014 Sep 18. Arch Biochem Biophys. 2014. PMID: 25241054 Review.
Cited by
-
Therapeutic Potential of Peucedanum japonicum Thunb. and Its Active Components in a Delayed Corneal Wound Healing Model Following Blue Light Irradiation-Induced Oxidative Stress.Antioxidants (Basel). 2023 May 29;12(6):1171. doi: 10.3390/antiox12061171. Antioxidants (Basel). 2023. PMID: 37371901 Free PMC article.
-
Chemokine Signaling during Midline Epithelial Seam Disintegration Facilitates Palatal Fusion.Front Cell Dev Biol. 2017 Oct 30;5:94. doi: 10.3389/fcell.2017.00094. eCollection 2017. Front Cell Dev Biol. 2017. PMID: 29164113 Free PMC article.
-
Heme Oxygenase 2 Binds Myristate to Regulate Retrovirus Assembly and TLR4 Signaling.Cell Host Microbe. 2017 Feb 8;21(2):220-230. doi: 10.1016/j.chom.2017.01.002. Epub 2017 Jan 26. Cell Host Microbe. 2017. PMID: 28132836 Free PMC article.
-
Pulmonary Transplantation of Human Induced Pluripotent Stem Cell-derived Macrophages Ameliorates Pulmonary Alveolar Proteinosis.Am J Respir Crit Care Med. 2018 Aug 1;198(3):350-360. doi: 10.1164/rccm.201708-1562OC. Am J Respir Crit Care Med. 2018. PMID: 29652170 Free PMC article.
-
The impact of heme oxygenase-2 on pharmacological research: A bibliometric analysis and beyond.Front Pharmacol. 2023 Apr 19;14:1156333. doi: 10.3389/fphar.2023.1156333. eCollection 2023. Front Pharmacol. 2023. PMID: 37153762 Free PMC article.
References
-
- Lu P., Li L., Liu G., van Rooijen N., Mukaida N., Zhang X. (2009) Opposite roles of CCR2 and CX3CR1 macrophages in alkali-induced corneal neovascularization. Cornea 28, 562–569 - PubMed
-
- Slegers T. P., Torres P. F., Broersma L., van Rooijen N., van Rij G., van der Gaag R. (2000) Effect of macrophage depletion on immune effector mechanisms during corneal allograft rejection in rats. Invest. Ophthalmol. Vis. Sci. 41, 2239–2247 - PubMed
-
- Slegers T. P., van der Gaag R., van Rooijen N., van Rij G., Streilein J. W. (2003) Effect of local macrophage depletion on cellular immunity and tolerance evoked by corneal allografts. Curr. Eye Res. 26, 73–79 - PubMed
Publication types
MeSH terms
Substances
Grants and funding
LinkOut - more resources
Full Text Sources
Other Literature Sources
Medical
Molecular Biology Databases
