. 2014 Oct 23;15(1):922.
doi: 10.1186/1471-2164-15-922.

Evolutionary history of Methyltransferase 1 genes in hexaploid wheat

Affiliations

Evolutionary history of Methyltransferase 1 genes in hexaploid wheat

Mélanie Thomas et al. BMC Genomics. .

Abstract

Background: Plant and animal methyltransferases are key enzymes involved in DNA methylation at cytosine residues, required for gene expression control and genome stability. Taking advantage of the new sequence surveys of the wheat genome recently released by the International Wheat Genome Sequencing Consortium, we identified and characterized MET1 genes in the hexaploid wheat Triticum aestivum (TaMET1).

Results: Nine TaMET1 genes were identified and mapped on homoeologous chromosome groups 2A/2B/2D, 5A/5B/5D and 7A/7B/7D. Synteny analysis and evolution rates suggest that the genome organization of TaMET1 genes results from a whole genome duplication shared within the grass family, and a second gene duplication, which occurred specifically in the Triticeae tribe prior to the speciation of diploid wheat. Higher expression levels were observed for TaMET1 homoeologous group 2 genes compared to group 5 and 7, indicating that group 2 homoeologous genes are predominant at the transcriptional level, while group 5 evolved into pseudogenes. We show the connection between low expression levels, elevated evolution rates and unexpected enrichment in CG-dinucleotides (CG-rich isochores) at putative promoter regions of homoeologous group 5 and 7, but not of group 2 TaMET1 genes. Bisulfite sequencing reveals that these CG-rich isochores are highly methylated in a CG context, which is the expected target of TaMET1.

Conclusions: We retraced the evolutionary history of MET1 genes in wheat, explaining the predominance of group 2 homoeologous genes and suggest CG-DNA methylation as one of the mechanisms involved in wheat genome dynamics.


Figures
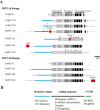
Figure 1
Figure 1
Gene structures of TaMET1 genes. A) The two MET1 genes from rice (OsMET1a; [GenBank: Os03g58400] and OsMET1b; [GenBank: Os07g08500]) were used as a reference to define two MET1 lineages (hereafter called MET-1a and MET-1b lineages). OsMET1a and OsMET1b are shown at the top of each lineage. Gene structures and splice junctions organize TaMET1 genes in 11 exons (black and grey boxes) and 10 introns (horizontal lines). The three distinct protein domains identified are indicated at the top of the figure: DNMT1-RFD (light grey), BAH-domain (dark grey) and DNA methyltransferase (black). TaMET1 genes from chromosome 2 and 7 as well as chromosome 5B are predicted to yield a full-length MET1 protein while 5A and 5D contain stop codons (*) and deletions (Δ). 5′ and 3′UTRs are indicated as smaller boxes. Potential promoter regions were defined as the ~2-3 kb region upstream of the coding sequences and are indicated as a thicker blue line. Unknown sequence insertion (TaMET-7D1) is indicated as a red line and transposable element insertion of Stowaway, Gypsy, Mariner and Mutator are indicated as red boxes. B) Methods used in this study.
Figure 2
Figure 2
MET1 phylogenetic trees in flowering plants and syntenic conservation. A) Maximum likelihood (ML) phylogenetic tree. The ML tree was inferred using cDNA sequences from dicot species including Arabidopsis thaliana (AtMET1: [TAIR:At5g49160]), Brassica rapa (BrMET1a and BrMET1b respectively [GenBank: AB251938 and AB25937]), Pisum sativum (PsMET1: [GenBank: AF034419]), Medicago truncatula: (MtMET1: [Phytozome: Medtr6g065580]), Daucus carota (DcMET1: [GenBank: AF007807]), Nicotiana tabacum (NtMET1: [Genbank: AB030726]), Solanum lycopersicum (SlMET1: [GenBank: AJ002140]), and monocot species including Sorghum bicolor (SbMET1a and SbMET1b respectively [Phytozome: Sb01g005084 and Sb02g004680]), Zea mays (ZmMET1b-1 and ZmMET1b-2 respectively [Phytozome: GRMZM2G333916 and GRMZM2G334041]), Oriza sativa (OsMET1a and OsMET1b respectively: [Genbank AB362510 and AB362511]), Brachypodium distachyon (BdMET1a and BdMET1b respectively [Phytozome: Bradi1g05380 and Bradi1g55287]), Hordeum vulgare (HvMET1-2 and HvMET1-7 respectively: [Ensembl Genomes: MLOC_61904.6 and: MLOC_10988.2], HvMET1-5 predicted from [GenBank: CAJW010043285]) and Triticum aestivum: TaMET-2A1, 2B1, 2D1, 5A1, 5B1, 5D1, 7A1, 7B1 and 7D1 (this study from IWGSC contigs). Numbers above branches indicate bootstrap values. Two monophyletic groups were defined and called the MET-1a and MET-1b lineages according to the OsMET1a and OsMET1b genes (indicated in boxes). The two gene duplication events observed in wheat and barley are indicated by an arrow. B) Micro-synteny analysis. Micro-synteny was established by BLASTn analysis between genes from brachypodium, rice and IWGSC sequences from wheat chromosomes as described in Methods. Syntenic conservation between rice (in white) and brachypodium (in black) correspond to the number of conserved genes in wheat/number of genes in the syntenic region from brachypodium or rice expressed as percentage. C) Gene structures of MET1 genes at chromosome 5. BLASTn analysis was used to align MET1 genes from Hordeum vulgare (HvMET1-5: [GenBank: CAJW010043285]), Triticum urartu (TuMET1-5 [Ensembl Plants: scaffold15783]), Aegilops tauschii (AetMET1-5 [Ensembl Plants: scaffold164515]) and Triticum aestivum (TaMET-5A1 and TaMET-5D1) (this study).
Figure 3
Figure 3
Evolution rate analyses of TaMET1 genes. A) Pair-wise comparisons. Synonymous (dS), non-synonymous (dN) and evolution rate (ω) are expressed in substitution/site and were performed using Codeml. TaMET1 from wheat homoeologous group 2 (grey boxes) were compared to Brachypodium distachyon [Phytozome: Bradi1g05380 and Bradi1g55287], Sorghum bicolor [Phytozome: Sb01g005084 and Sb02g004680], Oriza sativa [Genbank: AB362510 and AB362511], Zea mays [Phytozome: GRMZM2G333916 and GRMZM2G334041], Hordeum vulgare [Ensembl Genomes: MLOC_61904.6 and: MLOC_10988.2 and GenBank: CAJW010043285] and Triticum aestivum (TaMET-2A1, 2B1, 2D1, 5A1, 5B1, 5D1, 7A1, 7B1 and 7D1) (accession numbers in Additional file 8). Mean values of dS, dN and ω (with ω = dN/dS) were then computed for each homoeologous group. Whiskers represent the 10-90% range of mean values, boxes represent interquartile distances, the horizontal line across whiskers represents the median, and “+” the mean values. Kruskal Wallis non-parametric tests were applied to determine significant differences between mean values (*: P < 0.05; **: P < 0.01; ***: P < 0.001). B) PAML branch model. Tree topology was defined by a protein alignment using the same monocot species as in A). The two monophyletic groups MET-1a and MET-1b are indicated at the right. Three distinct evolution rates ω0 (red branches), ω1 (black branches) and ω2 (blue branches) are indicated as well as the two gene duplication events described in Figure 1 (arrow).
Figure 4
Figure 4
Expression profiles of wheat TaMET1 . A) Wheat RNA-seq. Data are expressed in Fragment Reads per Kilobase of Exon Model (FPKM) for each homoeologous group. FPKM were computed according to the following formula: FPKM = 109 x (C/NL) where C is the number of mappable reads on a feature, N is the total number of reads in the experiment and L (length) is the sum of exonic sequences in base pairs. Genes were considered to be expressed only for FPKM values >0.15. Samples covering various tissues (root, leave, stem, spike and grain) and developmental stages indicated as Zadoks (Z) scales are indicated at the bottom. Expression levels from TaMET1 genes of a given homoeologous group were used to compute mean values. TaMET1 from group 2 are expressed at higher levels in comparison to the other MET1 copies and display two main peaks of expression in the stem (Z30) and spike (Z32). B) RT-PCR gel analysis. RT-PCR with (+) or without (−) reverse transcriptase was performed for all TaMET1 genes. Control PCR reactions were performed for two constitutively expressed genes corresponding to Ta4045 and Ta54227 selected according to Paolacci et al. 2009. C) Quantitative RT PCR. Reactions were performed for TaMET-2A1, 2B1 and 2D1. Expression is relative to Ta4045 (dark grey) and Ta54227 (light grey). D) Schematic representation of TaMET1 loci. Position of MET1 genes on chromosome maps of 2B, 5B and 7A (chromosome arms in grey and centromere as white ellipse, not to scale). Top and bottom positions on ITMI reference map are indicated in cM.
Figure 5
Figure 5
CG enrichment and methylation at potential promoters of TaMET1 genes from homoeologous group 5 and 7. A) Frequency of CG dinucleotides. Frequencies were computed every 50 bp and are shown for each homoeologous group. Putative promoter region and coding sequence are delimited by respectively a blue and white box. Black bars numbered from PCR1 to PCR4 highlight the four regions studied by bisulfite sequencing and are indicated above the graphs. Region 4 is specific to the 7D homoeolog. Arrows indicate the putative transcription start site according to the RNA-seq data. B) Mean values of CG dinucleotides. Mean values of the number of CG dinucleotides of the three homoeologs (A, B and D) for a given homoeologous group (2, 5 and 7) in the putative promoter (blue) and coding (white) sequence regions. Differences between groups 5 and 7 putative promoter regions and group 2 are indicated above the histogram. Statistical significance was confirmed with a Kruskal Wallis non parametric tests with *: P < 0.05; **: P < 0.01; ***: P < 0.001. C) DNA methylation profiles as determined by bisulfite sequencing. Percentages of methylated cytosines of the four amplicons (PCR1 to 4) displayed in Figure 6A were determined after bisulfite sequencing. Percentages of methylation were recorded at each cytosine position and were used to compute a mean value for each amplicon in the CG, CHG or CHH sequence contexts.
Figure 6
Figure 6
Scheme of the genome dynamics at TaMET1 loci in the course of evolution. Scheme of the emergence of the nine TaMET1 genes is given at the left. Evolution time is given from the top to the bottom in MYa. The MET-1a lineage is expressed (green) and evolved at a low evolution rate while genes in the MET-1b lineage are repressed (red) or evolved as pseudogenes (Ψ, black boxes). The hypothetic succession of genomic events occurring at or including TaMET1 is proposed at the right.

References

    1. Gaut BS. Evolutionary dynamics of grass genomes. New Phytol. 2002;154:15–28. doi: 10.1046/j.1469-8137.2002.00352.x. - DOI
    1. Feldman M, Lupton F, Miller T. Wheats. In: Smartt J, Simmonds N, editors. Evol Crops Ed 2 Longman Sci Lond. 1995. pp. 184–192.
    1. Greer E, Martin AC, Pendle A, Colas I, Jones AME, Moore G, Shaw P. The Ph1 locus suppresses Cdk2-type activity during premeiosis and meiosis in wheat. Plant Cell Online. 2012;24:152–162. doi: 10.1105/tpc.111.094771. - DOI - PMC - PubMed
    1. Moore G, Devos KM, Wang Z, Gale MD. Cereal genome evolution: grasses, line up and form a circle. Curr Biol. 1995;5:737–739. doi: 10.1016/S0960-9822(95)00148-5. - DOI - PubMed
    1. Yu J, Hu S, Wang J, Wong GK-S, Li S, Liu B, Deng Y, Dai L, Zhou Y, Zhang X, Cao M, Liu J, Sun J, Tang J, Chen Y, Huang X, Lin W, Ye C, Tong W, Cong L, Geng J, Han Y, Li L, Li W, Hu G, Huang X, Li W, Li J, Liu Z, Li L, et al. A draft sequence of the rice genome (Oryza sativa L. ssp. indica) Science. 2002;296:79–92. doi: 10.1126/science.1068037. - DOI - PubMed

Publication types

Substances

LinkOut - more resources