. 2014 Dec 19;289(51):35042-60.
doi: 10.1074/jbc.M114.593491. Epub 2014 Oct 23.

The Drosophila Tis11 protein and its effects on mRNA expression in flies

Affiliations

The Drosophila Tis11 protein and its effects on mRNA expression in flies

Youn-Jeong Choi et al. J Biol Chem. .

Abstract

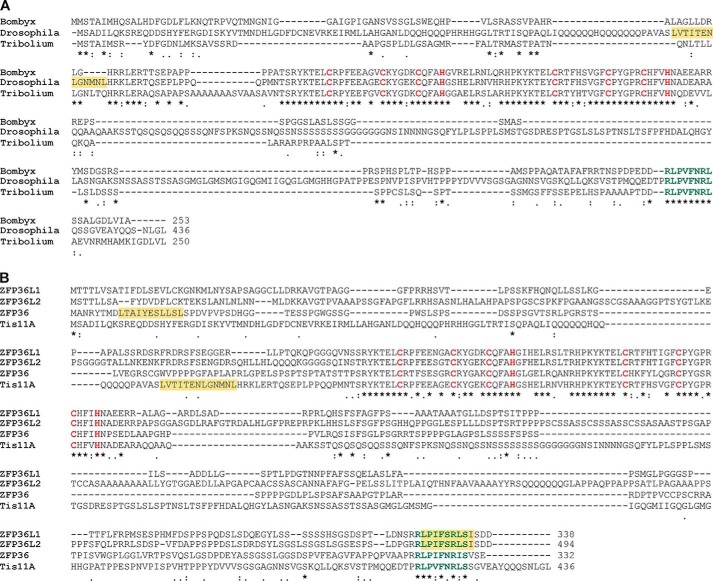
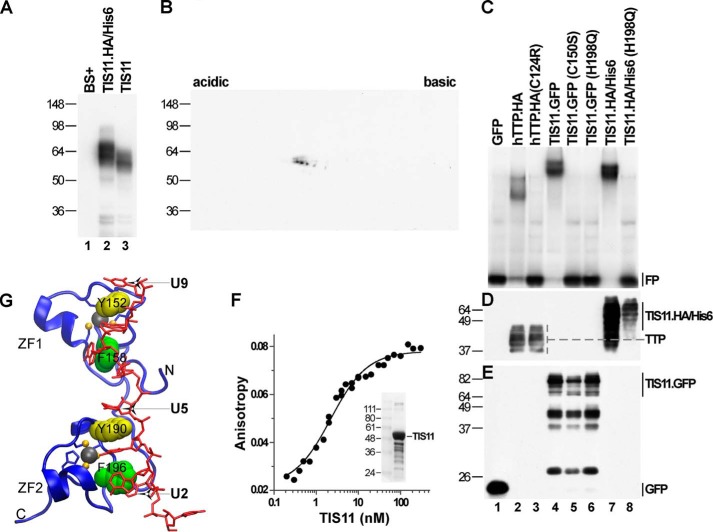
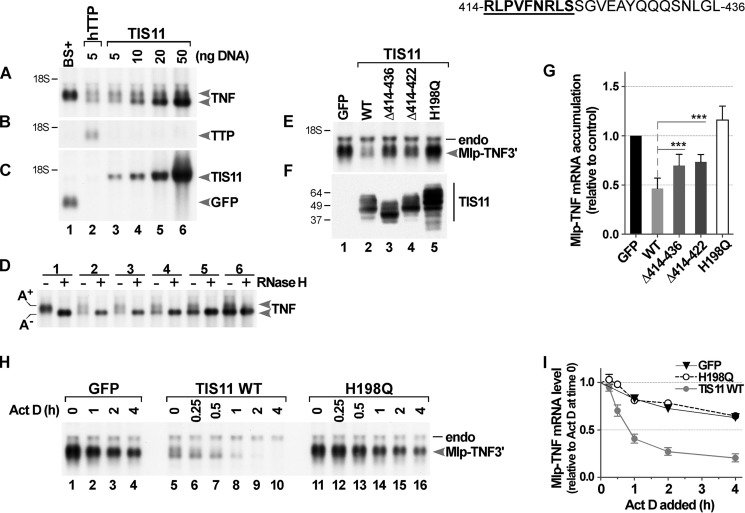
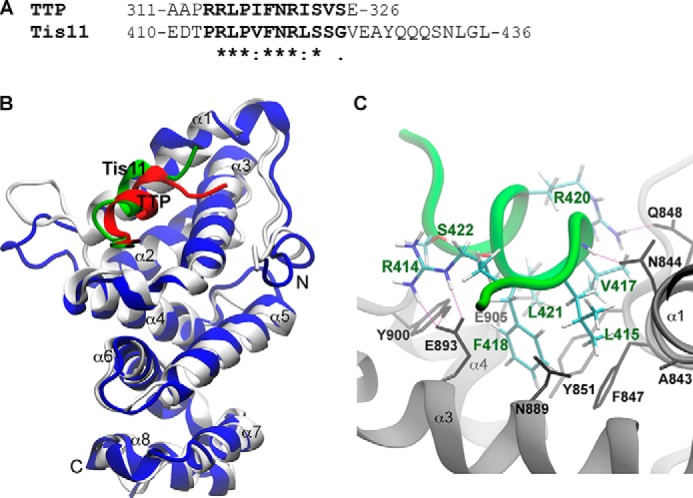
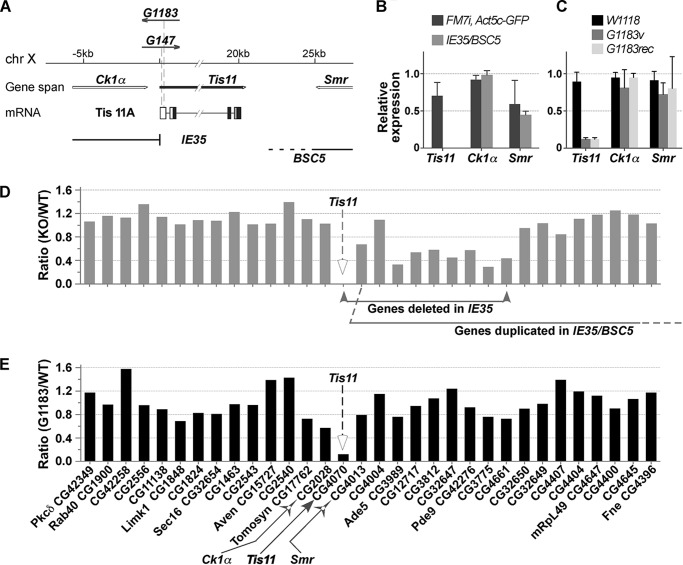
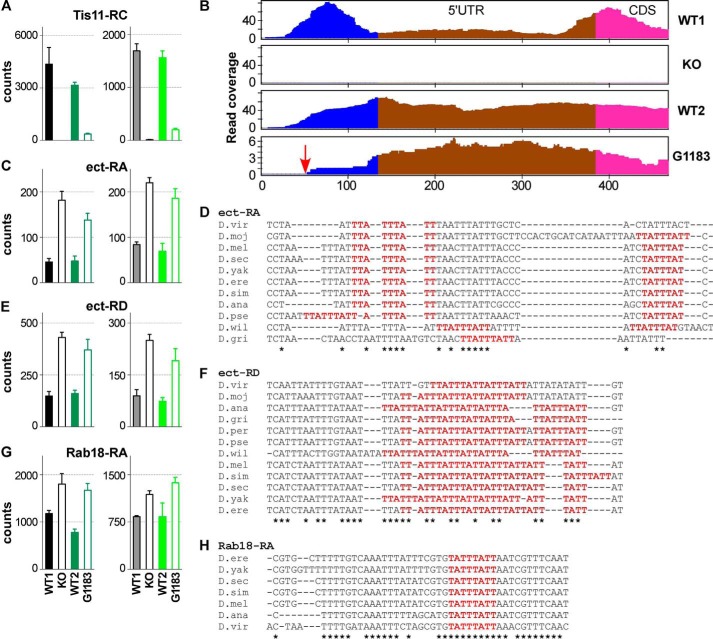
Members of the mammalian tristetraprolin family of CCCH tandem zinc finger proteins can bind to certain AU-rich elements (AREs) in mRNAs, leading to their deadenylation and destabilization. Mammals express three or four members of this family, but Drosophila melanogaster and other insects appear to contain a single gene, Tis11. We found that recombinant Drosophila Tis11 protein could bind to ARE-containing RNA oligonucleotides with low nanomolar affinity. Remarkably, co-expression in mammalian cells with "target" RNAs demonstrated that Tis11 could promote destabilization of ARE-containing mRNAs and that this was partially dependent on a conserved C-terminal sequence resembling the mammalian NOT1 binding domain. Drosophila Tis11 promoted both deadenylation and decay of a target transcript in this heterologous cell system. We used chromosome deletion/duplication and P element insertion to produce two types of Tis11 deficiency in adult flies, both of which were viable and fertile. To address the hypothesis that Tis11 deficiency would lead to the abnormal accumulation of potential target transcripts, we analyzed gene expression in adult flies by deep mRNA sequencing. We identified 69 transcripts from 56 genes that were significantly up-regulated more than 1.5-fold in both types of Tis11-deficient flies. Ten of the up-regulated transcripts encoded probable proteases, but many other functional classes of proteins were represented. Many of the up-regulated transcripts contained potential binding sites for tristetraprolin family member proteins that were conserved in other Drosophila species. Tis11 is thus an ARE-binding, mRNA-destabilizing protein that may play a role in post-transcriptional gene expression in Drosophila and other insects.

Keywords: AU-rich Elements; Deadenylation; Drosophila; Post-transcriptional Regulation; RNA-binding Protein; Zinc Finger; mRNA Decay.


Figures

FIGURE 1.
FIGURE 1.
Alignment of Drosophila Tis11 with related insect proteins and human TTP family members. A, ClustalW2 alignment of the Drosophila Tis11 protein (GenBankTM accession number NP_511141.2) with the corresponding proteins assembled from Bombyx mori (XP_004928274) and Tribolium castaneum (XP_968440). These two insects were chosen because their predicted protein sequences are the shortest we have found in insects to date. Asterisks indicate amino acid identity at that site; single and double dots indicate weak and strong amino acid similarities, respectively. The residues within the tandem zinc finger domains that are important for zinc coordination are in red; the conserved C-terminal domains discussed under “Materials and Methods” in green. The yellow shading indicates the nuclear export sequence identified in Ref. . B, ClustalW2 alignment of the Drosophila Tis11 protein with the three human TTP family members: TTP (ZFP36) (NP_003398.2), ZFP36L1 (NP_004917.2), and ZFP36L2 (NP_008818.3). Symbols and other markings are the same as for A.
FIGURE 2.
FIGURE 2.
Expression of Tis11 and binding to an ARE-containing RNA probe. A and B, Western blots of Tis11 protein expressed in 293 cells blotted with a Tis11 antibody (antibody 1729; 1:5000). In A, the blot was from an SDS-polyacrylamide gel. Each lane was loaded with 10 μg of cytosolic protein prepared from 293 cells transfected with vector alone (BS+; lane 1), Tis11.HA/His6 (lane 2), and Tis11 (without an epitope tag; lane 3). In B, the blot was from a two-dimensional electrophoresis of extract (5 μg) used in lane 3 in A. C, autoradiograph of an RNA gel shift experiment using an RNA probe derived from the mouse TNF 3′-UTR. The position of the free probe (FP) is indicated. The probes were incubated with 10 μg of cytosolic protein from 293 cells transfected with GFP (GFP; lane 1) and the same amount of cytosolic protein from 293 cells transfected with plasmids encoding HA-tagged human (h) TTP (lane 2), the HA-tagged human TTP zinc finger mutant C124R (lane 3), the Drosophila Tis11-GFP fusion protein (lane 4), Tis11-GFP with the first zinc finger mutation C150S (lane 5), Tis11-GFP with the second zinc finger mutation H198Q (lane 6), the Tis11.HA/His6 fusion protein (lane 7), and the Tis11.HA/His6 fusion protein with the second zinc finger mutation H198Q (lane 8). D and E, Western blots (D blotted with HA probe (H7)-HRP, sc-7392; E blotted with GFP (B2)-HRP, sc-9996, Santa Cruz Biotechnology, Inc.) demonstrating the roughly equivalent expression of the various proteins used for the gel shift experiment in C. The positions of the various proteins are indicated to the right of D and E. F, analysis of the binding of the purified recombinant protein to an oligonucleotide probe (Fl-AUUUAUUUAUUUA), using fluorescence anisotropy. The average Kd from two similar experiments was 2.3 nm. The inset shows a Coomassie Blue-stained gel of the recombinant protein (second lane), with molecular weight standards in the first lane. G, ribbon diagram of the simulation solution structure model of the peptide backbone of the Tis11 TZF domain (in blue) and sticks representing the ARE 9-mer (in red). Zinc fingers 1 and 2 (ZF1 and ZF2) and the termini of the peptide (N and C) are indicated. The side chains of Tyr152 and Tyr190 (at the CX5C intervals of finger 1 and finger 2, respectively, in yellow spheres) are shown stacking with RNA bases U9-Tyr152-U8 and U5-Tyr190-U4. The side chains of Phe158 and Phe196 (at the CX3H intervals of finger 1 and finger 2, respectively, in green spheres) are shown stacking with RNA bases A7-Phe158-U6 and A3-Phe196-U2. Also shown are the zinc atoms in gray spheres and the side chains of the zinc-coordinating residues of each finger. Nucleosides U9, U5, and U2 are indicated with arrows.
FIGURE 3.
FIGURE 3.
Tis11-promoted mRNA decay and deadenylation. A, Northern blot demonstrating the effect of Tis11 to promote the decay of mouse TNF mRNA. A shows the level of TNF mRNA accumulation after co-transfection of a TNF plasmid (CMV.mTNFα) (31) with the vector BS+ (lane 1), 5 ng of a construct encoding human TTP (CMV.hTTP.tag; lane 2), and a 10-fold range of amounts of a construct encoding Tis11 (CMV.DTis11.HA/His6; lanes 3–6). The two arrowheads labeled TNF indicate the fully adenylated (top arrowhead) and deadenylated (bottom arrowhead) TNF mRNA. B, a similar blot that had been probed with a TTP cDNA; C, a similar blot that had been probed with a mixture of Tis11 and GFP cDNAs, documenting the expression of Tis11 mRNA at the different amounts of transfected DNA. At 5 ng of transfected human TTP DNA (A, lane 2), there was a marked decrease in TNF mRNA accumulation compared with control (A, lane 1); this was accompanied by the appearance of a lower, presumably deadenylated band of TNF mRNA. When Tis11 DNA was transfected at the same low concentration (5 ng; A, lane 3), there were a decrease in TNF mRNA accumulation and the appearance of a lower mRNA band that were similar to the accumulation seen with 5 ng of transfected human TTP DNA. At 10 ng of Tis11 plasmid (A, lane 4), there was still a decrease in total TNF mRNA accumulation compared with the control transfection, but there was increased accumulation of the lower, deadenylated band of the TNF transcript. With increasing amounts of transfected Tis11 DNA above 10 ng, there was an increase in the accumulation of the deadenylated form of the TNF mRNA (A, lanes 5 and 6, indicated by the bottom TNF arrow). See the Western blots shown in Fig. 2D for protein expression from 293 cells transfected with the same constructs expressing human TTP (lane 2 of Fig. 2D) or Tis11 (lane 7 of Fig. 2D). D, results of an RNase H/oligo(dT) experiment, with the pairs of lanes numbered 1–6 representing the samples from those lane numbers in A. The presence or absence of RNase H is indicated by the plus and minus signs. RNA from these incubations was subjected to Northern blotting with a TNF cDNA probe. The band labeled A+ indicates the fully polyadenylated form of the transfected expressed mRNA, and the band labeled A indicates the deadenylated form of this transcript. In the top right-hand corner of the figure is shown the sequence of the Tis11 protein C terminus, from residue 414 to the C terminus (of NP_511141), with Arg414–Ser422 underlined. E, representative Northern blot demonstrating the involvement of the Tis11 C-terminal domain to promote the decay of a fusion Mlp-Tnf3′ mRNA. The top band seen in each lane (endo) shows the level of endogenous MLP mRNA that served as a loading control for subsequent calculations. The lower band shows the levels of the fusion Mlp-Tnf3′ mRNA accumulation after co-transfection of the Mlp-Tnf3′ plasmid (3 μg/plate) with EGFP (5 ng/plate, lane 1), a construct encoding WT HA.Tis11 (lane 2), or constructs encoding mutants of HA.Tis11 (amino acids 414–436 deleted (Δ414-end, lanes 3), amino acids 414–422 deleted (Δ414–422, lanes 4) or the construct Tis11.HA/His6(H198Q), in which the zinc-coordinating His198 in finger 2 was mutated to Gln (H198Q; lanes 5). The constructs expressing Tis11 were co-transfected at 10 ng/plate. F, Western blot of protein extracts prepared from 293 cells transfected with the same constructs expressing Tis11 or its deletion or zinc finger mutants, as indicated. Each plate of cells was transfected with 0.2 μg of expression construct DNA, together with 4.8 μg of vector BS+ DNA. Each gel lane was loaded with 10 μg of extract protein, and an antibody directed at the HA epitope was used for blotting. G, comparison of the effects of mutant and WT Tis11 on the accumulation of the Mlp-Tnf3′ mRNA, expressed relative to control (EGFP co-transfection as control, mean ± S.D. (error bars)) from the results of six similar co-transfection assays. Each of the Northern blots was quantitated using a PhosphorImager, and the level of Mlp-Tnf3′ mRNA expression of each gel lane was normalized to the endogenous Mlp mRNA expression level. To compare the effects between mutant and WT Tis11 on the accumulation of the Mlp-Tnf3′ mRNA, two-tailed Student's t tests were performed, as indicated by the dotted line (***, p < 0.001), with a Bonferroni correction applied when needed for multiple comparisons. In H, 293 cells were co-transfected with constructs expressing either GFP, WT Tis11, or the mutant Tis11 H198Q, along with a construct encoding an Mlp-Tnf3′ fusion mRNA, as described in detail under “Materials and Methods.” Total cellular RNA was prepared from three plates of cells for each condition and was used for Northern blots, hybridized with a mouse Mlp cDNA. The arrows point to bands corresponding to endogenous 293 cell MLP mRNA (endo) and the transfected-expressed Mlp-Tnf3′ mRNA. In I, results were averaged from five experiments that were identical to that shown in H, and the mean values from these experiments ± S.D. were plotted as fractions of the values at time 0. These values were based on PhosphorImager quantitation of the Mlp-Tnf3′ mRNA, normalized for endogenous Mlp mRNA. The dashed lines indicate 100 and 50% of the original value.
FIGURE 4.
FIGURE 4.
Simulation solution structures of the human and Drosophila NOT1 peptides binding to the human TTP and Drosophila Tis11 C-terminal peptides. A, sequences and numbering of the aligned C-terminal regions from human TTP and Drosophila Tis11, as shown in Fig. 1B. Asterisks and other symbols are as described in the legend to Fig. 1. In B, the ribbon diagram shows the backbone superposition of human NOT1 (silver; residues 820–999 of GenBankTM accession number NP_001252541.1), Drosophila Not1 (blue; residues 892–1071 from NP_001097242.1), and C-terminal peptides of human TTP (red; residues 315–325 of GenBankTM accession number AAH09693.1) and Drosophila Tis11 (green, residues 413–424 of NP_511141). C, a ribbon diagram of the proposed interface between the TTP binding domain of the human NOT1 protein (silver) and the Tis11 C-terminal peptide (green). Interacting side chains of NOT1 (gray) and Tis11 peptide (colors, with green labels) are shown as sticks. Hydrophobic interactions that are thought to strengthen the interaction are shown between the side chains of NOT1 (Phe847, Tyr851, Tyr900, hydrophobic portions of Asn889 and Glu905) and Tis11 (Leu415, Val417, Phe418, and Leu421). Note that the salt bridges formed between the side chains (NOT1 Glu893 and Arg414 of Tis11, 2.75 and 2.85 Å; NOT1 Gln848 and Arg420 of Tis11, 2.80 Å) and hydrogen bonds (Glu893 and Tyr900 of NOT1; NOT1 Asn844 and Val417 backbone of Tis11, 2.81 Å; and backbones of Tis11 Phe418 and Ser422) also contribute to the predicted stability of the interface. The predicted bonds formed are shown in magenta.
FIGURE 5.
FIGURE 5.
The Tis11 locus and transcript expression in the two types of mutant flies. A, a portion of the Drosophila X chromosome, comprising the Tis11 locus and neighboring genes, with the centromere to the right. The positions of the P{EP}G1183 and P{EP}G147 transposons within the first exon of Tis11 are indicated by the vertical dashed lines; the arrows indicate the direction of transcription driven by UAS promoter elements within the transposons. IE35 is an imprecise excision allele obtained by mobilizing the P{EP}G147 transposon. It deletes Tis11 from the P element insertion site and extends into the neighboring Smr locus. Dp(1;Y)BSC5 is a Y chromosome bearing an X chromosome fragment that contains Smr but not Tis11. The combination of IE35 and BSC5 results in a complete loss of Tis11 expression but normal Smr expression. Dotted portions of the line reflect an uncertain end point. The positions and transcription directionality of the Ck1α and Smr loci are shown. The exons comprising the Tis11 mRNA are indicated, with no shading representing the 5′-UTR, and light gray shading representing the TZF domain of the protein. The broken line indicates a large gap in the locus representing ∼15 kb of intron 2. Shown in B are real-time RT-PCR data, showing means ± S.D. (error bars), from IE35 males carrying Dp(1;Y)BSC5, a Y chromosome with a duplication of Smr, demonstrating the absence of Tis11 transcripts in the null flies, whereas CK1α and Smr transcript levels were not affected. In B, transcript levels were measured from 1–5-day-old IE35/BSC5 males compared with FM7i, Act5C-GFP/BSC5 sibling males of the same age. Five pools of 30 flies each were collected for each stock. C, similar real-time RT-PCR data from WT flies and two types of G1183 flies, viable flies that spontaneously arose from the original lethal stock (G1183v), and viable flies that were intentionally recombined to remove lethal mutations elsewhere, as discussed under “Materials and Methods” (G1183rec). For the analysis shown in C, G1183v, G1183rec, and w1118 0–1-day-old males were frozen and collected into three pools each of 25–40 flies in each pool. The RNA samples used for B and C were different from the samples used for the mRNASeq analysis discussed below. The adult male G1183 flies of both types expressed approximately one-eighth of the normal level of Tis11 mRNA (C), but Smr and Ck1α expression were unaffected in either the spontaneous (G1183v) or recombinant (G1183rec) flies. In D and E are shown gene level ratios of transcript expression from the mRNASeq experiments for the genes around Tis11 on the Drosophila X chromosome, with D showing the ratios of null/control and E showing the ratios of G1183/control (the centromere is to the right in both panels). In D, the location of genes deleted in IE35 and the genes duplicated in BSC5 are indicated at the bottom of the graph. Note the absence of Tis11 transcript expression in D as well as the depressed expression of several genes centromeric to Tis11 on the X chromosome. In E, the Tis11 transcripts were decreased by 8.6-fold, but most neighboring genes were relatively unaffected in the G1183 flies.
FIGURE 6.
FIGURE 6.
Transcript expression determined by mRNASeq in WT, null, and G1183 flies. In the left panel of A are shown the average read count totals for the Tis11-RC mRNA, demonstrating its lack of expression in the null flies, as expected, and its decreased expression by ∼8.6-fold in the G1183 flies. The right panel of A shows NanoString quantitation of a subset of the original RNA samples used for mRNASeq, in which four samples were used in each group, except for “KO,” which used three samples. B shows the average depth of read coverage for the 5′-end of the Tis11-RC transcript from the mRNASeq data from the four groups of flies. Each panel in B represents average depth of read coverage from all four biological samples used for that set. The contributions of the two exons comprising the 5′-UTR are shown in blue and brown, respectively, with the 5′-end of the protein coding sequence (CDS) shown in pink; this is also encoded by the second exon. The arrow points to the site of the EP element insertion in the G1183 genome. There were no detectable transcript reads 5′ of this site. Note that the vertical axis in the fourth panel is 10-fold expanded compared with the other three. Shown in the left panels of C and E are the means ± S.D. (error bars) of the mRNASeq expression results from two ect transcript variants, ect-RA and ect-RD, which have different 3′-UTRs; data from the NanoString analysis of a subset of these samples are shown in the right panels of C and E. The potential TTP family member binding sites in these transcripts are shown in D and F, respectively, and only show sequences that are conserved among the Drosophila species contained in the “classical” tree described in FlyBase. The optimum TTP binding heptamers, UAUUUAU, are highlighted in red. Identical residues at each position are indicated by asterisks. In the left panel of G are shown the mRNASeq expression data for Rab18 mRNA, encoding a small GTPase, whose 3′-UTR contains only a single heptamer binding site, with the corresponding NanoString data in the right panel of G. The potential TTP family member binding site in this transcript was less well conserved than seen with the other potential targets in this figure in some of the evolutionarily more distant Drosophila species (H). In A, C, E, and G, the mutant means (i.e. KO and G1183) from both the mRNASeq and NanoString analyses were statistically different from their respective WT means (p < 0.01 using Student's t test) in all cases.

References

    1. Shaw G., Kamen R. (1986) A conserved AU sequence from the 3′ untranslated region of GM-CSF mRNA mediates selective mRNA degradation. Cell 46, 659–667 - PubMed
    1. Bakheet T., Williams B. R., Khabar K. S. (2003) ARED 2.0: an update of AU-rich element mRNA database. Nucleic Acids Res. 31, 421–423 - PMC - PubMed
    1. Chen C. Y., Shyu A. B. (1995) AU-rich elements: characterization and importance in mRNA degradation. Trends Biochem. Sci. 20, 465–470 - PubMed
    1. Blackshear P. J. (2002) Tristetraprolin and other CCCH tandem zinc-finger proteins in the regulation of mRNA turnover. Biochem. Soc. Trans. 30, 945–952 - PubMed
    1. Brooks S. A., Blackshear P. J. (2013) Tristetraprolin (TTP): interactions with mRNA and proteins, and current thoughts on mechanisms of action. Biochim. Biophys. Acta 1829, 666–679 - PMC - PubMed

Publication types

MeSH terms

Associated data