. 2014 Oct 24;346(6208):1257998.
doi: 10.1126/science.1257998. Epub 2014 Oct 23.

Lattice light-sheet microscopy: imaging molecules to embryos at high spatiotemporal resolution

Affiliations

Lattice light-sheet microscopy: imaging molecules to embryos at high spatiotemporal resolution

Bi-Chang Chen et al. Science. .

Abstract

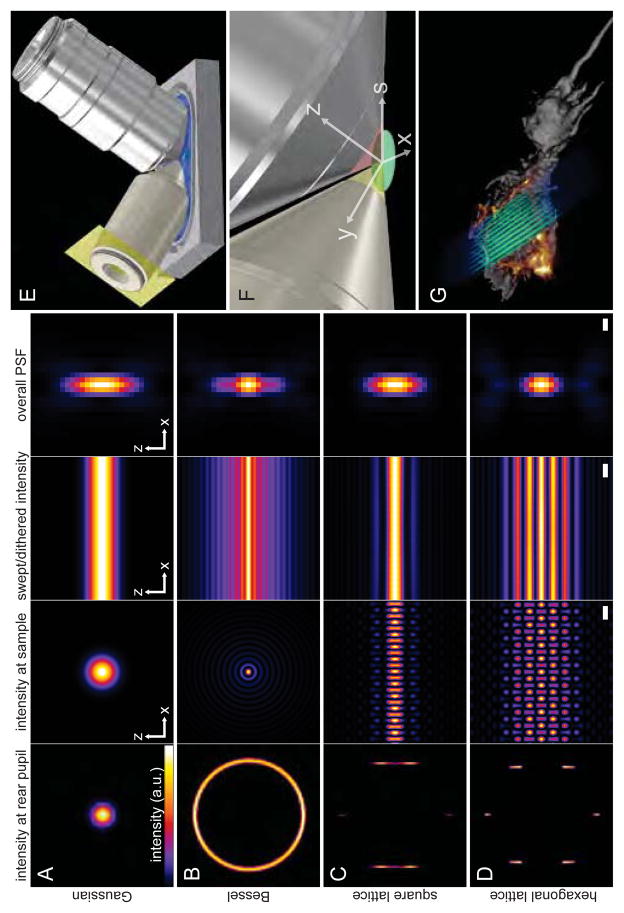
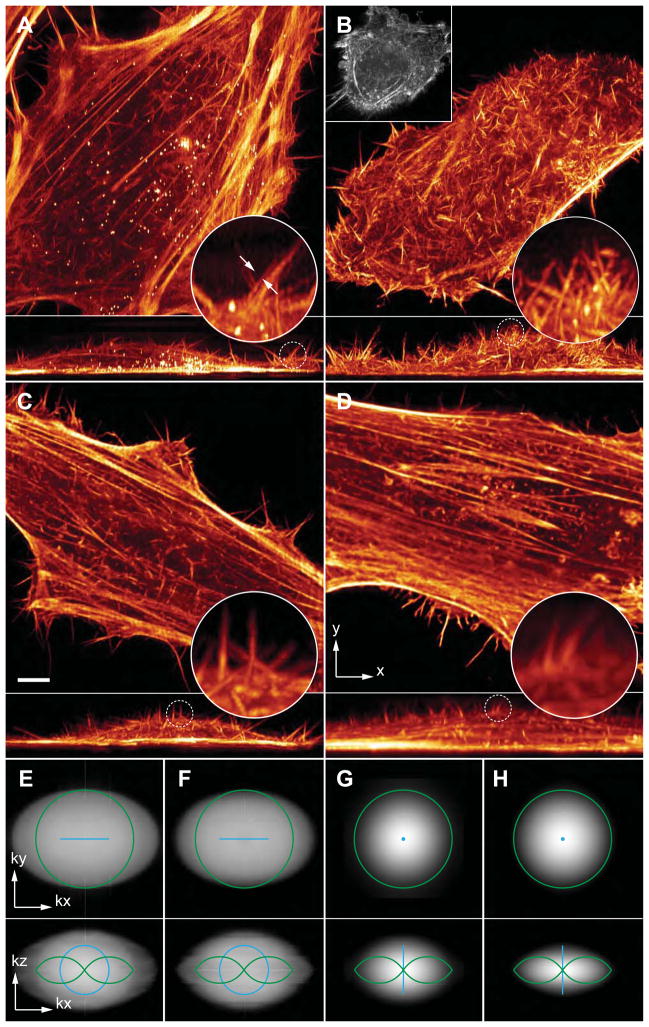
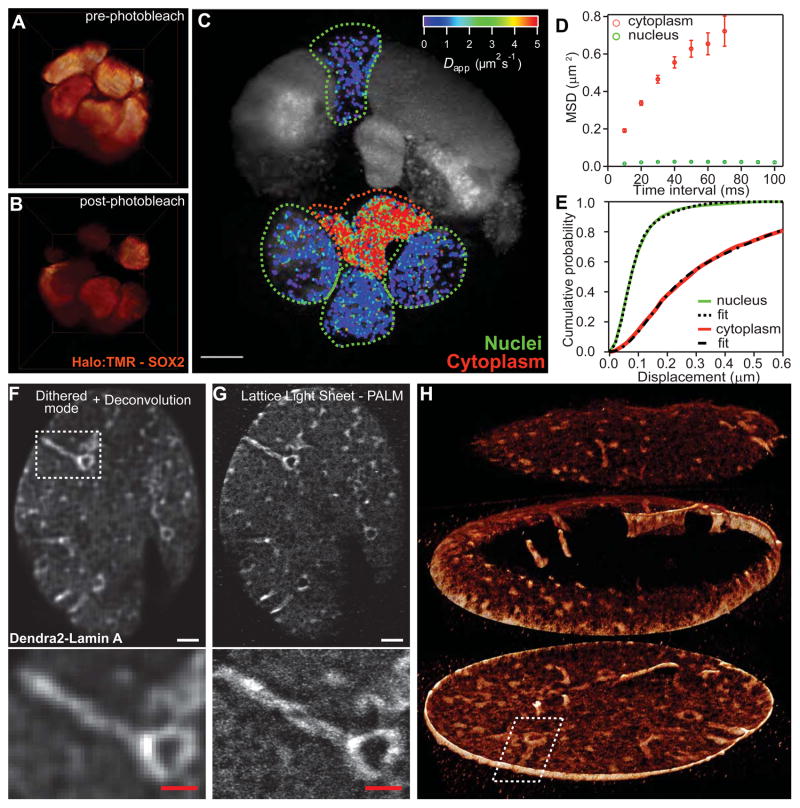
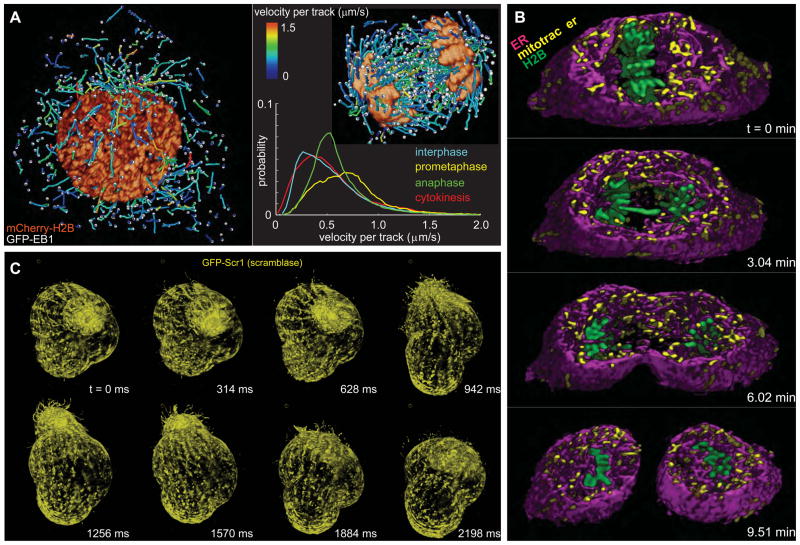
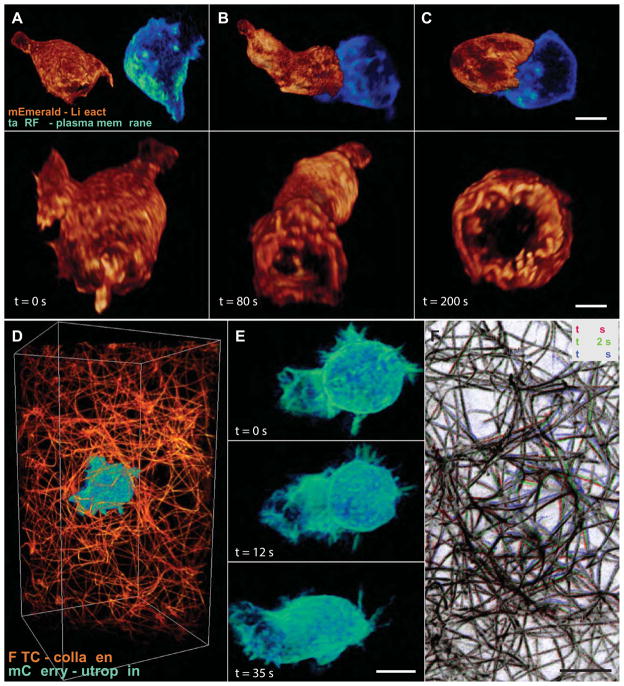
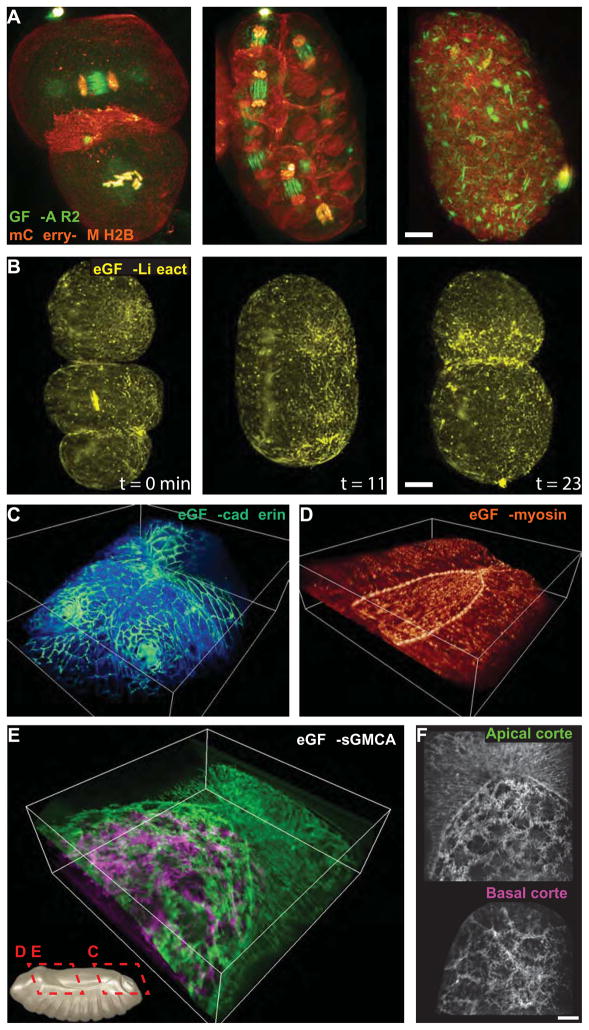
Although fluorescence microscopy provides a crucial window into the physiology of living specimens, many biological processes are too fragile, are too small, or occur too rapidly to see clearly with existing tools. We crafted ultrathin light sheets from two-dimensional optical lattices that allowed us to image three-dimensional (3D) dynamics for hundreds of volumes, often at subsecond intervals, at the diffraction limit and beyond. We applied this to systems spanning four orders of magnitude in space and time, including the diffusion of single transcription factor molecules in stem cell spheroids, the dynamic instability of mitotic microtubules, the immunological synapse, neutrophil motility in a 3D matrix, and embryogenesis in Caenorhabditis elegans and Drosophila melanogaster. The results provide a visceral reminder of the beauty and the complexity of living systems.


Figures

Fig. 1
Fig. 1. Methods of light sheet microscopy
(A) The traditional approach, where a Gaussian beam is swept across a plane to create the light sheet. (B) A Bessel beam of comparable length produces a swept sheet with a much narrower core, but flanked by sidebands arising from concentric side lobes of the beam. (C, D) Bound optical lattices (cf., movie S1) create periodic patterns of high modulation depth across the plane, greatly reducing the peak intensity and, as we have found, the phototoxicity in live cell imaging. The square lattice in (C) optimizes the confinement of the excitation to the central plane, and the hexagonal lattice in (D) optimizes the axial resolution as defined by the overall point spread function (PSF) of the microscope. The columns in (A to D) show: the intensity pattern at the rear pupil plane of the excitation objective; the cross-sectional intensity of the pattern in the xz plane at the focus of the excitation objective (scale bar, 1.0 μm); the cross-sectional intensity of the light sheet created by dithering the focal pattern along the x axis (scale bar, 1.0 μm); and the xz cross section of the overall PSF of the microscope (scale bar, 200 nm). (E) Model showing the core of our microscope, with orthogonal excitation (left) and detection (right) objectives dipped in a media-filled bath (cf., fig. S4). (F) Higher magnification view, showing the excitation (yellow) and detection (red) light cones, which meet at a common focus within a specimen that is either mounted or cultured onto a cover glass within the media. The x,y,and z directions are indicated. The s-axis defines the direction the specimen moves from image plane to image plane. (G) Representation of a lattice light sheet (blue-green) intersecting a cell (gray) to produce fluorescence (orange) in a single plane. The cell is swept through the light sheet to generate a 3D image (cf., movie S2).
Fig. 2
Fig. 2. Experimental comparisons of Bessel beam and lattice light sheet microscopy
(A) 3D renderings in the xy (top) and xz (bottom) directions of the 300th time point of a 4D data set of a living HeLa cell transfected with mEmerald-Lifeact, taken in the SIM mode with a five-phase hexagonal lattice at 7.5 sec intervals. (B) First time point from a different live HeLa cell imaged with a stepped Bessel beam and five-phase SIM at 30 sec intervals. Square inset shows the same cell, retracted at the 32nd time point (cf., movie S3). The coherent lattice light sheet generates a pattern of much greater modulation depth (cf., movie S4), requiring less power and generating less damage to produce an image of comparable SNR. It also allows finer, three-phase patterns to be used for SIM mode imaging as fast as 4 sec per volume (cf. movie S5). (C) 300th time point from a third HeLa cell, acquired with a hexagonal lattice in the dithered mode at 1.5 sec intervals (cf., movie S7). Scale bar, 5 μm. The low photoxicity of this mode permits even light-sensitive specimens such as D. discoideum to be imaged for long periods (cf. movies S9, S10). (D) First time point from a fourth HeLa cell, acquired with a swept Bessel beam at 1.5 sec intervals. Circular insets in (A to D) shows magnified xz views of filopodia. (E) Optical transfer functions (OTFs) in log scale showing amplitudes of spatial frequencies for the hexagonal lattice SIM mode used in (A). (F) OTFs for the Bessel SIM mode used in (B). (G) OTFs for the dithered hexagonal lattice used in (C). (H) OTFs for the swept Bessel mode used in (D). Green curves in (E to H) represent the diffraction limit of the detection. Blue curves in (E to H) represent the diffraction limit of the excitation.
Fig. 3
Fig. 3. Single molecule tracking and super-resolution
(A) Lattice light sheet 3D rendering of a ~35 μm diameter spheroid of mouse embryonic stem cells containing TMR-labeled Sox2 transcription factors. (B) Same spheroid, showing bleached region after single molecule imaging with the light sheet dithered at a fixed plane (cf., movies S11, S12). (C) Local apparent diffusion coefficients of Sox2 molecules. Scale bar, 5 μm. (D) Mean square displacements (MSDs) of molecules in the nuclei (7608 trajectories) or cytoplasm (2339 trajectories) with error bars indicating the standard errors of the means. (E) Corresponding cumulative distribution functions (CDFs) representing the fraction of all tracked molecules at a given MSD or below. (F) Diffraction-limited maximum intensity projection (MIP) from a 600 nm thick slab cut through the bottom of the nuclear membrane of a fixed U2OS cell expressing Dendra2-Lamin A, taken in the dithered lattice mode. (G) Superresolution MIP from the same slab, taken with 3D PALM, where molecules in successive planes are excited with a dithered lattice light sheet. Scale bars, 2 μm in upper views of (F and G), 1 μm in zoomed boxes below. (H) Exploded view of the full 3D rendering of the nuclear envelope by PALM (cf., movie S13).
Fig. 4
Fig. 4. Intracellular dynamics in three dimensions
(A) Cells in prophase (left) and anaphase (right), showing histones and 3D tracks of growing microtubule ends, color coded by velocity. Color coding of each track by height (movie S15) or growth phase lifetime (movie S16) is also possible. Each image in A represents a distillation of a few time points from a 4D, two-color data set typically covering hundreds of time points per cell (cf., movie S17). Graph shows the distribution of growth rates at different stages of mitosis, averaged across nine to twelve cells (cf., figs. S8, S9). (B) 3D spatial relationship of histones (green), mitochondria (yellow), and the endoplasmic reticulum (magenta) at four time points during mitosis in a slab extracted from a larger 4D, three-color data set of HeLa cells imaged for 300 time points (cf., movie S18). (C) Volume renderings at eight consecutive time points of a single specimen of the protozoan T. thermophila taken from a 4D data set spanning 1250 time points (cf., movie S19). Imaging at 3 ms/frame in a single plane (cf., movie S20) reveals the motions of individual cilia.
Fig. 5
Fig. 5. Imaging cell-cell and cell-matrix interactions
(A) T cell expressing mEmerald-Lifeact (orange) approaching a target cell expressing a plasma membrane marker fused to tagRFP (blue), as seen from the side (top) and from the viewpoint of the APC (bottom). (B) Initial contact. (C) The two cells, after the formation of a mature immunological synapse. These data represent three time points from a 4D, two-color data set spanning 400 time points. Scale bars, 4.0 μm (top), 5.0 μm (bottom). Other cell-cell interactions such as the aggregation starved D. discoideum cells can likewise be studied for extended periods (cf. movie S21). (D) Neutrophil-like human HL-60 cell expressing mCherry-utrophin in a fluorescently labeled collagen matrix. (E) Volume renderings of the cell at three time points extracted from a 4D, two-color data set of the cell and the matrix covering 250 time points (cf., movie S23). Scale bar, 5.0 μm. (F) Overlaid MIPs in three different colors of the collagen at the same three time points. Colored regions highlight local displacements of the matrix by the cell. Scale bar, 5.0 μm.
Fig. 6
Fig. 6. Embryogenesis in three dimensions
(A) Distribution of chromosomal passenger protein GFP-AIR-2 (green) relative to plasma membranes and histones (red) in C. elegans embryos at the two cell (left, cf. fig. S12, movie S25) through six cell developmental stages. Scale bar, 5 μm. Even late stage development of C. elegans can be studied (cf., movie S26) although muscle contractions make it difficult to follow specific features continuously. (B) xy view MIPs of the distribution of lifeact in a C. elegans embryo during pseudocleavage ingression (left), in maintenance phase just prior to the first division (center), and during the first division (right), extracted from a 4D data set covering 368 time points (cf., fig. S13, movie S27). Scale bar, 5 μm. (C) Volume rendering of DE-cadherin during dorsal closure in Drosophila development, highlighting boundaries between amnioserosa cells and the formation of spriacles, from a 4D data set containing 840 time points (cf., movie S28), bounding box, 86 × 80 × 31 μm. (D) Myosin II during dorsal closure, highlighting the myosin-rich purse string at the interface between the outer epithelium and the amnioserosa, from a 4D data set covering 1000 time points (cf., movie S29), bounding box, 80 × 80 × 26 μm. (E) sGMCA, a marker of filamentous actin at the plasma membrane, during dorsal closure, from a 4D data set covering 639 time points (cf., movie S30), bounding box, 73 × 73 × 26 μm. (F) MIPs highlighting cortical actin at the apical and basal surfaces of the amnioserosa, extracted from (E). Scale bar, 10 μm.

Comment in

  • Microscopy: Advancing imaging.
    Du Toit A. Du Toit A. Nat Rev Mol Cell Biol. 2014 Dec;15(12):769. doi: 10.1038/nrm3910. Nat Rev Mol Cell Biol. 2014. PMID: 25415507 No abstract available.
  • Light microscopy with lattices.
    Vogt N. Vogt N. Nat Methods. 2014 Dec;11(12):1191. doi: 10.1038/nmeth.3196. Nat Methods. 2014. PMID: 25584377 No abstract available.

Similar articles

Cited by

References

    1. Murphy DB, Davidson MW. Fundamentals of light microscopy and electronic imaging. 2. Wiley-Blackwell; Hoboken, N.J: 2013. p. xiii.p. 538.
    1. Stephens DJ, Allan VJ. Light microscopy techniques for live cell imaging. Science. 2003;300:82–86. - PubMed
    1. Huisken J, Stainier DY. Selective plane illumination microscopy techniques in developmental biology. Development. 2009;136:1963–1975. - PMC - PubMed
    1. Huisken J, Swoger J, Del Bene F, Wittbrodt J, Stelzer EH. Optical sectioning deep inside live embryos by selective plane illumination microscopy. Science. 2004;305:1007–1009. - PubMed
    1. Krzic U, Gunther S, Saunders TE, Streichan SJ, Hufnagel L. Multiview light-sheet microscope for rapid in toto imaging. Nature methods. 2012;9:730–733. - PubMed

Publication types

MeSH terms