. 2014 Jun;33(3):171-180.
doi: 10.1111/cgf.12373.

Visualizing Validation of Protein Surface Classifiers

Affiliations

Visualizing Validation of Protein Surface Classifiers

A Sarikaya et al. Comput Graph Forum. 2014 Jun.

Abstract

Many bioinformatics applications construct classifiers that are validated in experiments that compare their results to known ground truth over a corpus. In this paper, we introduce an approach for exploring the results of such classifier validation experiments, focusing on classifiers for regions of molecular surfaces. We provide a tool that allows for examining classification performance patterns over a test corpus. The approach combines a summary view that provides information about an entire corpus of molecules with a detail view that visualizes classifier results directly on protein surfaces. Rather than displaying miniature 3D views of each molecule, the summary provides 2D glyphs of each protein surface arranged in a reorderable, small-multiples grid. Each summary is specifically designed to support visual aggregation to allow the viewer to both get a sense of aggregate properties as well as the details that form them. The detail view provides a 3D visualization of each protein surface coupled with interaction techniques designed to support key tasks, including spatial aggregation and automated camera touring. A prototype implementation of our approach is demonstrated on protein surface classifier experiments.

Keywords: Categories and Subject Descriptors (according to ACM CCS); J.3.1 [Computer Applications]; Life and Medical Sciences—Biology and Genetics.


Figures

Figure 1
Figure 1
Visualization of a validation experiment for a DNA-binding surface classifier. The corpus overview (left) is configured to display each molecule as a quilted glyph and orders these glyphs by classifier performance to show how performance varies over the molecules. Selected molecules (left, yellow box) are visualized as heatmaps in a subset view (middle) and ordered by molecule size to help localize the positions of errors relative to correct answers. The detail view (right) shows a selected molecule to confirm that most errors (blue, red) are close to the correctly found binding site (green).
Figure 2
Figure 2
Different glyph encodings for overviews afford different observations about the data.
Figure 3
Figure 3
Clustering similar values creates discrete regions that can be identified visually and by interaction.
Figure 4
Figure 4
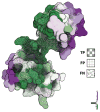
A multivariate encoding for a scalar field (shown as the purple-to-green color field) overlayed on classification values shown as procedural textures (checkerboard, grid, Perlin noise). Note how TP (checkerboard) and FP (grid) generally correlate with positive charge (green), suggesting a correlation between charge and positive predictions.
Figure 5
Figure 5
Our approach applied to the validation of a DNA-binding classifier. The overview window (left) displays the corpus rendered as quilted blocks (§3.2), giving an idea of aggregate performance across the corpus. The detail window (right) shows the clustered classifications (§4.1) for PDB: 1PVR_A, highlighted in yellow in the overview window. These clusters are itemized (lower right), allowing for highlighting regions of interest and automatic navigation to view a selected region.
Figure 6
Figure 6
Analyzing the spatial clustering of a DNA-binding classifier reveals high-level trends of classification.
Figure 7
Figure 7
Analysis of a surface descriptor-based, calcium-binding classifier. Modifying the decision boundary indicates that calcium may bind in multiple environments not adequately generalized by the classifier.

References

    1. Albers D, Correll M, Franconeri S, Gleicher M. A task driven framework for visualizing time series data. Proc 2014 ACM Human Factors in Computing Systems. 2014 ACM. 3, 4. - PMC - PubMed
    1. Albers D, Dewey C, Gleicher M. Sequence surveyor: Leveraging overview for scalable genomic alignment visualization. IEEE TVCG. 2011 Dec;17(12):2392–2401. 3. - PubMed
    1. Ariely D. Seeing sets: Representation by statistical properties. Psych Sci. 2001;12(2):157–162. 3. - PubMed
    1. Bertin J. Graphics and graphic information processing. Walter de Gruyter; 1981. 3.
    1. Bruls M, Huizing K, Van Wijk J. Data Visualization. Springer; 2000. Squarified treemaps; pp. 33–42. 5.

LinkOut - more resources