. 2014 Sep 24;12(1):44.
doi: 10.1186/s12953-014-0044-3. eCollection 2014.

Impact of three commercial feed formulations on farmed gilthead sea bream (Sparus aurata, L.) metabolism as inferred from liver and blood serum proteomics

Affiliations

Impact of three commercial feed formulations on farmed gilthead sea bream (Sparus aurata, L.) metabolism as inferred from liver and blood serum proteomics

Stefania Ghisaura et al. Proteome Sci. .

Abstract

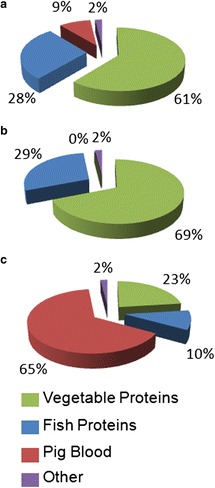
Background: The zootechnical performance of three different commercial feeds and their impact on liver and serum proteins of gilthead sea bream (Sparus aurata, L.) were assessed in a 12 week feeding trial. The three feeds, named A, B, and C, were subjected to lipid and protein characterization by gas chromatography (GC) and liquid chromatography-tandem mass spectrometry (LC-MS/MS), respectively.

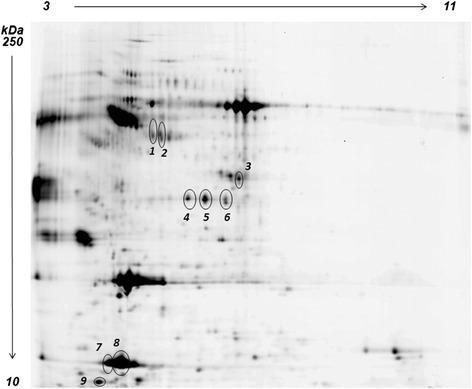
Results: Feed B was higher in fish-derived lipids and proteins, while feeds C and A were higher in vegetable components, although the largest proportion of feed C proteins was represented by pig hemoglobin. According to biometric measurements, the feeds had significantly different impacts on fish growth, producing a higher average weight gain and a lower liver somatic index in feed B over feeds A and C, respectively. 2D DIGE/MS analysis of liver tissue and Ingenuity pathways analysis (IPA) highlighted differential changes in proteins involved in key metabolic pathways of liver, spanning carbohydrate, lipid, protein, and oxidative metabolism. In addition, serum proteomics revealed interesting changes in apolipoproteins, transferrin, warm temperature acclimation-related 65 kDa protein (Wap65), fibrinogen, F-type lectin, and alpha-1-antitrypsin.

Conclusions: This study highlights the contribution of proteomics for understanding and improving the metabolic compatibility of feeds for marine aquaculture, and opens new perspectives for its monitoring with serological tests.

Keywords: 2D DIGE; Aquaculture; Farmed fish; Fish feed; Gilthead sea bream; Ingenuity pathway analysis; Liver proteins; Mass spectrometry; Proteomics; Serum proteins.


Figures

Figure 1
Figure 1
Protein sources in feeds. Pie charts illustrating the distribution of proteins according to their source in the three feeds used for this study and named a, b, and c. Protein sources are classified according to LC-MS/MS protein identification and ontology attribution.
Figure 2
Figure 2
Statistical analysis of 2D DIGE results. Statistical analysis of 2D DIGE results. The figure illustrates the heat map (a) and the score plot (b) obtained upon comparison of the liver protein profiles of sea breams at T0 (blue) and after 12 weeks (T12) of feeding with feeds A (pink), B (green), and C (dark red). In the heat map (a), each cell represents the differential protein expression trends, indicating increased expression in green and decreased expression in red. Clustering is performed according to the proteins (left dendrogram) and the sample (top dendrogram). In the score plot (b), sample clustering according to the principal component analysis is reported.
Figure 3
Figure 3
Representative 2D PAGE of gilthead sea bream liver proteins. Differentially expressed proteins are circled in the map, and information on their differential expression and identity is reported in Table 3.
Figure 4
Figure 4
Statistical analysis of 2D DIGE results obtained for fish serum. The figure illustrates the heat map (a) and the score plot (b) obtained upon comparison of the serum protein profiles of sea breams at T0 (blue) and after 12 weeks (T12) of feeding with Feeds A (pink), B (green), and C (dark red). In the heat map (a), each cell represents the differential protein expression trend, indicating increased expression in green and decreased expression in red. Clustering is performed according to the proteins (left dendrogram) and the sample (top dendrogram). In the score plot (b), sample clustering according to the principal component analysis is reported.
Figure 5
Figure 5
Representative 2D PAGE of gilthead sea bream serum proteins in the 3 to 11 pH range. Spots showing a differential abundance in T12A, T12B and T12C, and having a valid protein identification are circled in the map, and information on their changes and identities is reported in Table 5.
Figure 6
Figure 6
Statistical analysis of 2D DIGE results. The figure illustrates the heat map (a) and the score plot (b) obtained upon comparison of the serum protein profiles of sea breams at T12A (pink) and T12B (green). In the heat map (a), each cell represents the differential protein expression trend, indicating increased expression in green and decreased expression in red. Clustering is performed according to the proteins (left dendrogram) and the sample (top dendrogram). In the score plot (b), sample clustering according to the principal component analysis is reported.
Figure 7
Figure 7
Representative 2D PAGE of gilthead sea bream serum proteins in the 4 to 7 pH range. Spots showing a differential abundance in T12A and T12B and a valid protein identification are circled in the map, and information on their changes and identity is reported in Table 6.

References

    1. FAO . The state of world fisheries and aquaculture. Rome: FAO Fisheries and Aquaculture Department. Food and Agriculture Organization of the United Nations; 2010.
    1. Naylor RL, Goldburg RJ, Primavera JH, Kautsky N, Beveridge MC, Clay J, Folke C, Lubchenco J, Mooney H, Troell M. Effect of aquaculture on world fish supplies. Nature. 2000;405:1017–1024. doi: 10.1038/35016500. - DOI - PubMed
    1. Carter CG, Hauler RC. Fish meal replacement by plant meals in extruded feeds for Atlantic salmon, Salmo salar L. Aquaculture. 2000;185:299–311. doi: 10.1016/S0044-8486(99)00353-1. - DOI
    1. Kaushik SJ, Cravedi JP, Lalles JP, Sumpter J, Fauconneau B, Laroche M. Partial or total replacement of fish meal by soybean protein on growth, protein utilization, potential estrogenic or antigenic effects, cholesterolemia and flesh quality in rainbow trout, Oncorhynchus mykiss. Aquaculture. 1995;133:257–274. doi: 10.1016/0044-8486(94)00403-B. - DOI
    1. Vilhelmsson OT, Martin S a M, Médale F, Kaushik SJ, Houlihan DF. Dietary plant-protein substitution affects hepatic metabolism in rainbow trout (Oncorhynchus mykiss) Br J Nutr. 2004;92:71–80. doi: 10.1079/BJN20041176. - DOI - PubMed