. 2014 Sep 29:3:15.
doi: 10.1186/2046-7648-3-15. eCollection 2014.

The impact of submaximal exercise during heat and/or hypoxia on the cardiovascular and monocyte HSP72 responses to subsequent (post 24 h) exercise in hypoxia

Affiliations

The impact of submaximal exercise during heat and/or hypoxia on the cardiovascular and monocyte HSP72 responses to subsequent (post 24 h) exercise in hypoxia

Ben J Lee et al. Extrem Physiol Med. .

Abstract

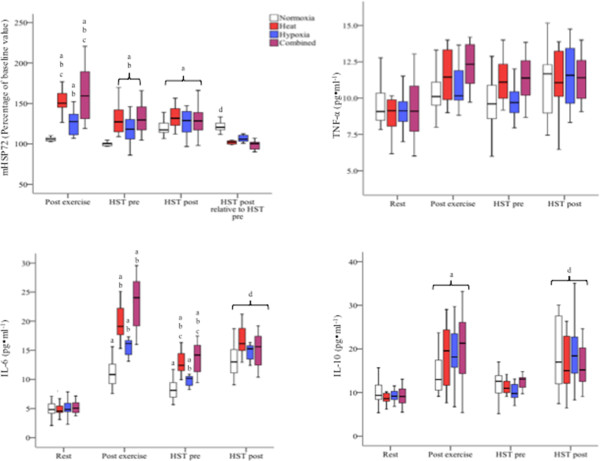
Background: The aims of this study were to describe the cellular stress response to prolonged endurance exercise in acute heat, hypoxia and the combination of heat and hypoxia and to determine whether prior acute exposure to these stressors improved cellular tolerance to a subsequent exercise bout in hypoxia 24 h later.

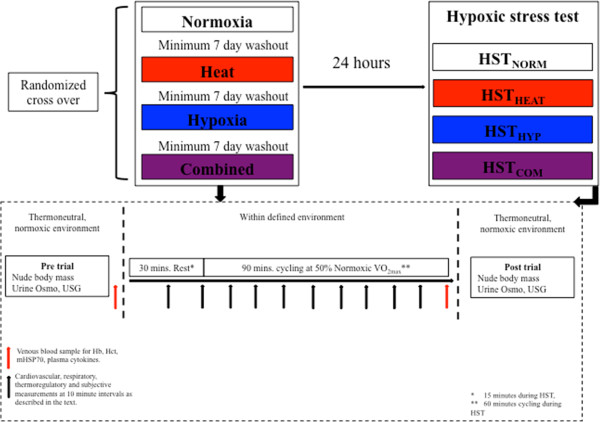
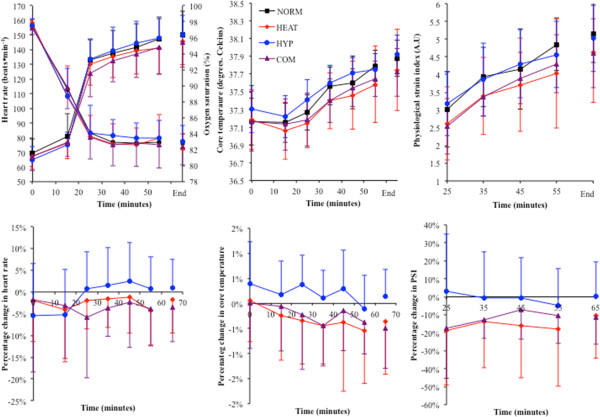
Methods: Twelve males (age 22 ± 4 years, height 1.77 ± 0.05 m, mass 79 ± 12.9 kg, VO2 max 3.57 ± 0.7 L · min(-1)) completed four trials (30-min rest, 90-min cycling at 50% normoxic VO2 max) in normothermic normoxia (NORM; 18°C, FIO2 = 0.21), heat (HEAT; 40°C, 20% RH), hypoxia (HYP; FIO2 = 0.14) or a combination of heat and hypoxia (COM; 40°C, 20% RH, FIO2 = 0.14) separated by at least 7 days. Twenty-four hours after each trial, participants completed a hypoxic stress test (HST; 15-min rest, 60-min cycling at 50% normoxic VO2 max, FIO2 = 0.14). Monocyte heat shock protein 72 (mHSP72) was assessed immediately before and after each exercise bout.

Results: mHSP72 increased post exercise in NORM (107% ± 5.5%, p > 0.05), HYP (126% ± 16%, p < 0.01), HEAT (153% ± 14%, p < 0.01) and COM (161% ± 32%, p < 0.01). mHSP72 had returned to near-resting values 24 h after NORM (97% ± 8.6%) but was elevated after HEAT (130% ± 19%), HYP (118% ± 17%) and COM (131% ± 19%) (p < 0.05). mHSP72 increased from baseline after HSTNORM (118% ± 12%, p < 0.05), but did not increase further in HSTHEAT, HSTHYP and HSTCOM.

Conclusions: The prior induction of mHSP72 as a result of COM, HEAT and HYP attenuated further mHSP72 induction after HST and was indicative of conferred cellular tolerance.

Keywords: Cross-acclimation; Cycling; Humans; Preconditioning.


Figures

Figure 1
Figure 1
Experimental schematic. Experimental design and data collection timings during the initial environmental exposure and the subsequent hypoxic stress test 24 h later.
Figure 2
Figure 2
Exercise times to exhaustion during each condition. The top panel displays exercise times until exhaustion during the four experimental trials. Data show the first, second (median) and third interquartile ranges (coloured boxes) and shortest achieved time in each condition. a = significantly different from NORM (p < 0.01). The bottom panel displays the participant dropout during each condition. The arrow denotes the point at which pairwise comparisons were made for statistical analysis between the 12 participants.
Figure 3
Figure 3
Heart rate and SpO 2 responses to acute rest and exercise under heat or hypoxic stress. The top panel shows the heart rate response during each trial; the bottom panel shows the SpO2 response during each trial. a = HEAT, HYP and COM different from to NORM (p < 0.05), b = COM different from HYP (p < 0.05), c = HEAT different from HYP (p < 0.05), d = COM different from NORM (p < 0.05), e = HYP and COM different from NORM and HEAT (p < 0.01).
Figure 4
Figure 4
Thermoregulatory responses to each experimental trial. The top left panel shows core temperature during each trial, the top right panel shows mean skin temperature during each trial, the bottom left panel shows mean body temperature during each trial and the bottom right panel shows physiological strain index during each trial. a = HEAT and COM different from NORM and HYP (p < 0.01), b = HEAT, HYP and COM different from NORM (p < 0.05), c = COM different from HYP (p < 0.05).
Figure 5
Figure 5
Monocyte HSP72 and cytokine responses to each experimental trial. The top left panel shows mHSP72 expression over time for each of the four experimental conditions. Data at the end of exercise (day 1), pre-HST and post-HST are expressed as a percentage of the control value [26]. The top right panel shows TNF-α before and after each experimental trial. The bottom left panel shows IL-6 and the bottom right panel shows IL-10 before and after each experimental trial. Data show the first, second (median) and third interquartile ranges (coloured boxes) and the lowest and highest values in each condition (T bars). Letters represent significant differences between means (p < 0.05). Error bars represent the standard error of the mean. a = different from baseline (p < 0.05), b = different from NORM (p < 0.05), c = different from HYP (p < 0.05), d = different from pre-HST to post-HST.
Figure 6
Figure 6
Cardiovascular and thermoregulatory responses to each HST. The top left panel shows the heart rate and SpO2 responses to each HST. The top middle panel shows the core temperature response to each HST. The top right panel shows the physiological strain index during each HST. The bottom panels represent the percentage difference in heart rate, core temperature and PSI, respectively, in relation to the HSTNORM trial.

Similar articles

Cited by

References

    1. González-Alonso J, Crandall CG, Johnson JM. The cardiovascular challenge of exercising in the heat. J Physiol. 2008;586(1):45–53. - PMC - PubMed
    1. Naeije R. Physiological adaptation of the cardiovascular system to high altitude. Prog Cardiovasc Dis. 2010;52(6):456–466. doi: 10.1016/j.pcad.2010.03.004. - DOI - PubMed
    1. Mazzeo R. Physiological responses to exercise at altitude. Sports Med. 2008;38(1):1–8. doi: 10.2165/00007256-200838010-00001. - DOI - PubMed
    1. Tipton M. A case for combined environmental stressor studies. Extreme Physiol Med. 2012;1(1):7. doi: 10.1186/2046-7648-1-7. - DOI - PMC - PubMed
    1. Horowitz M. In: Progress in Brain Research. Volume 162. Sharma HS, editor. ᅟ: Elsevier; 2007. Heat acclimation and cross-tolerance against novel stressors: genomic–physiological linkage; pp. 373–392. - PubMed

LinkOut - more resources