. 2014 Oct 24;9(10):e111450.
doi: 10.1371/journal.pone.0111450. eCollection 2014.

Single cell adhesion assay using computer controlled micropipette

Affiliations

Single cell adhesion assay using computer controlled micropipette

Rita Salánki et al. PLoS One. .

Abstract

Cell adhesion is a fundamental phenomenon vital for all multicellular organisms. Recognition of and adhesion to specific macromolecules is a crucial task of leukocytes to initiate the immune response. To gain statistically reliable information of cell adhesion, large numbers of cells should be measured. However, direct measurement of the adhesion force of single cells is still challenging and today's techniques typically have an extremely low throughput (5-10 cells per day). Here, we introduce a computer controlled micropipette mounted onto a normal inverted microscope for probing single cell interactions with specific macromolecules. We calculated the estimated hydrodynamic lifting force acting on target cells by the numerical simulation of the flow at the micropipette tip. The adhesion force of surface attached cells could be accurately probed by repeating the pick-up process with increasing vacuum applied in the pipette positioned above the cell under investigation. Using the introduced methodology hundreds of cells adhered to specific macromolecules were measured one by one in a relatively short period of time (∼30 min). We blocked nonspecific cell adhesion by the protein non-adhesive PLL-g-PEG polymer. We found that human primary monocytes are less adherent to fibrinogen than their in vitro differentiated descendants: macrophages and dendritic cells, the latter producing the highest average adhesion force. Validation of the here introduced method was achieved by the hydrostatic step-pressure micropipette manipulation technique. Additionally the result was reinforced in standard microfluidic shear stress channels. Nevertheless, automated micropipette gave higher sensitivity and less side-effect than the shear stress channel. Using our technique, the probed single cells can be easily picked up and further investigated by other techniques; a definite advantage of the computer controlled micropipette. Our experiments revealed the existence of a sub-population of strongly fibrinogen adherent cells appearing in macrophages and highly represented in dendritic cells, but not observed in monocytes.


Conflict of interest statement

Competing Interests: The competing interest of B.S., that he is a founder of CellSorter, the startup company that developed the device used in the authors' experiments, does not alter the authors' adherence to PLOS ONE policies on sharing data and materials.

Figures

Figure 1
Figure 1. Schematic representation of the hydrodynamic adhesion force measurement on a single cell using a micropipette.
Cell is shown with its nucleus and cell adhesion molecules in its plasma membrane. After coating the plastic surface with fibrinogen, we blocked nonspecific cell adhesion by the protein non-adhesive PLL-g-PEG polymer. Cells attached to the surface were scanned and recognized by software in the microscopic images captured on a motorized inverted microscope. Objective lens is shown under the cell. A glass micropipette (symbolized by its grey wall) was led to each detected cell one by one. Cell adhesion was probed by the application of a precisely controlled fluid flow through the micropipette. Experimental vacuum value measured in the syringe connected to the micropipette (Figure S1 in File S1) was converted to an estimated hydrodynamic lifting force acting on single cells according to computer simulations of the flow in the micropipette (Fig. 4).
Figure 2
Figure 2. Images of adherent monocytes (a, b), and those of their in vitro differentiated descendants: macrophages (c, d) and dendritic cells (e, f) on the fibrinogen coated and PLL-g-PEG blocked surface (a, c, e), and on the control surface without fibrinogen coating but also blocked by PLL-g-PEG (b, d, f) before applying vacuum by the automated micropipette.
Region of interest (ROI) of the Petri dish was scanned by the motorized microscope. Cells were detected automatically. After we adjusted the vacuum in the syringe, the micropipette visited and tried to pick up the detected cells one by one. After each cycle of the adhesion force measurement, the ROI of the Petri dish was scanned again and the vacuum was increased to the next level. The micropipette visited again each location determined according to the initial scanning. In the upper left corner of panel (b) we show the aperture of the glass micropipette with an inner diameter of 70 µm. Scale bar: 100 µm.
Figure 3
Figure 3. Ratio of adherent monocytes on fibrinogen and PLL-g-PEG surfaces at different lifting forces, as was measured by the automated micropipette.
Experimental vacuum value in the syringe was converted to an estimated hydrodynamic lifting force acting on single cells according to computer simulations of the flow in the micropipette (Fig. 4).
Figure 4
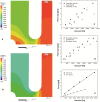
Figure 4. Results of the numerical simulations.
Typical pressure distribution in case of free-slip (a) and no-slip (b) boundary conditions imposed on the bottom of the Petri dish. The flow field has an axial symmetry, and only the right half of the geometry is shown in the side views. The real-life velocity profile (and other integral quantities such as the pressure drop) is expected to lie between these two extreme cases. Distance between the tip of the micropipette and the bottom of the Petri dish: H = 10 µm. Flow rate: 6 µl/s. To validate the results of simulations we compared the simulated flow rate of the micropipette to the experimental values as a function of the vacuum value with H = 5 µm (c) and H = 10 µm (d) taking into consideration corrections due to gravity, pressure drop in the PTFE tube and the flow velocity in the micropipette (Figure S1 in File S1). Simulation with free-slip condition on the bottom of the Petri dish proved to be a better approximation of the experiments than the no-slip simulations. Thus we determined the lifting force (e) acting on the hemisphere model of the cell on the basis of the free-slip simulations as a function of the vacuum applied to the micropipette. With a linear fitting we found the following relation between the hydrodynamic lifting force (FL) and the vacuum (V) applied to the micropipette: FL = 0.172 [nN/Pa] * V +311 [nN] (R2 = 0.996) if H = 5 µm. FL = 0.071 [nN/Pa] * V +961 [nN] (R2 = 0.999) if H = 10 µm. We used these coefficients to convert the experimental vacuum values to an estimated lifting force.
Figure 5
Figure 5. Ratio of adherent dendritic cells and macrophages on fibrinogen and PLL-g-PEG surfaces at different estimated lifting forces, as was measured with the automated micropipette.
* indicates significant difference between the ratio of dendritic cells and macrophages on fibrinogen, P<0.05 (t-test).
Figure 6
Figure 6. Images of adherent monocytes (a, b), and those of macrophages (c, d), and dendritic cells (e, f) on fibrinogen coating in the microfluidic channel of the flow chamber.
Arrows indicate the direction of flow (b, d, f). Flow could easily remove monocytes. Macrophages (d) and dendritic cells (f) remained on the surface but became elongated at high shear stress. When the flow rate was further increased most cells detached from the surface. To give an insight into the morphology change of cells, figure shows images captured at the following shear stress values: 0 Pa (a, c, e); 21.3 Pa (b); 128.1 Pa (d), and 181.4 Pa (f). In the experiments we used the same sequence of shear stress values for all three cell types. Scale bar: 100 µm.
Figure 7
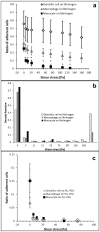
Figure 7. Result of the shear stress measurements.
(a): Ratio of adherent dendritic cells, macrophages and monocytes as a function of the shear stress applied in the fibrinogen coated and PLL-g-PEG blocked microfluidic flow chambers. * indicates significant difference between the ratio of adherent monocytes and that of the differentiated cells on fibrinogen, P<0.05 (t-test). Difference between macrophages and dendritic cells was not statistically significant in this experiment. (b): Same results as shown in panel (a) but presented as the density function of the distribution of cells. Instead of the shift of the distribution measured with monocytes a new peak appears in case of macrophages and dendritic cells at high adhesion strength. (c): Cell adhesion to the PLL-g-PEG coated surfaces of the microfluidic channel measured and presented similarly to (a). Data of the three cell types collapse to a single curve on this weakly adherent surface. Most cells are washed away with a very low shear stress.
Figure 8
Figure 8. Schematic illustration of adhesion force measurements on individual monocyte cells using the step-pressure micropipette manipulation technique.
a) The tip of the micropipette with an aperture of 5 µm was positioned above the selected cell with a diameter of ∼15 µm cell attached onto the fibrinogen coated surface. We positioned the tip above a cell, adjusted the vacuum in the syringe, and opened the fluidic valve constantly. We approached onto the cell with the tip gently until we touched it. Then we lifted again the tip to 30 µm above the surface. Red arrow indicates the motion of the micropipette when detaching the cell from the surface. If the cell was picked up we turned to the next cell. If the cell remained on the surface we increased the vacuum. Suction force was increased in steps as long as the selected cell were removed. We calculated the ratio of adherent cells remaining on the surface after applying the next step of vacuum (panel c). We normalized the number of adherent cells by the total number of cells probed in the experiment. Number of cells washed away from the surface before the measurement was not considered here to decrease standard error according to the consensus, when the number of probed cells is low, e.g., in AFM experiments. Data need to be rescaled to compare to Fig. 3, i.e., normalized by the ratio of initially adherent cells. Step-pressure micropipette manipulation results confirmed the range of adhesion force measured by the hydrodynamic flow of the 70 µm micropipette.

Similar articles

Cited by

References

    1. Alberts B (1994) Molecular biology of the cell. (3rd Ed) New York: Garland Publishing. 966–996 p.
    1. Kim C, Ye F, Ginsberg MH (2011) Regulation of Integrin Activation. Annual Review of Cell and Developmental Biology 27: 321–345. - PubMed
    1. Hogg N, Patzak I, Willenbrock F (2011) The insider’s guide to leukocyte integrin signalling and function. Nature Reviews Immunology. 11: 416–426. - PubMed
    1. Gahmberg CG (1997) Leukocyte adhesion: CD11/CD18 integrins and intercellular adhesion molecules. Current Opinion in Cell Biology 9: 643–650. - PubMed
    1. Hogg N, Henderson R, Leitinger B, McDowall A, Porter J, et al. (2002) Mechanisms contributing to the activity of integrins on leukocytes. Immunological Reviews 186: 164–171. - PubMed

Publication types

LinkOut - more resources