

Global chemical composition of ambient fine particulate matter for exposure assessment
- PMID: 25343705
- PMCID: PMC4238642
- DOI: 10.1021/es502965b
Global chemical composition of ambient fine particulate matter for exposure assessment
Abstract
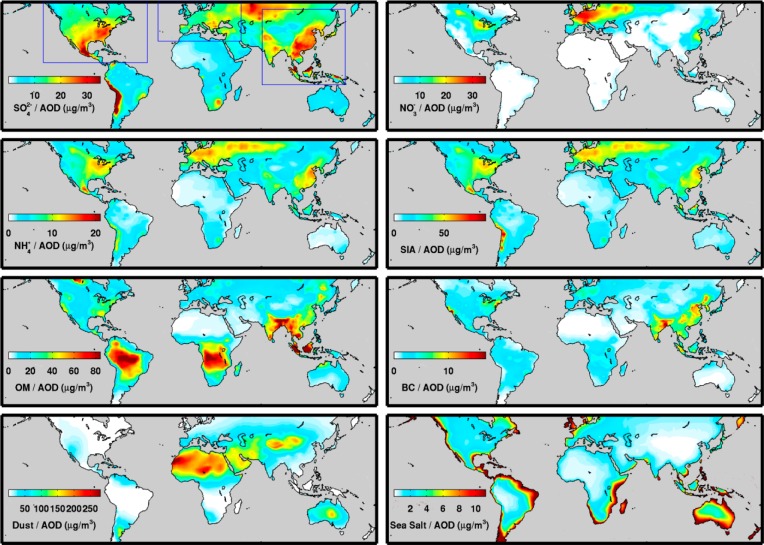
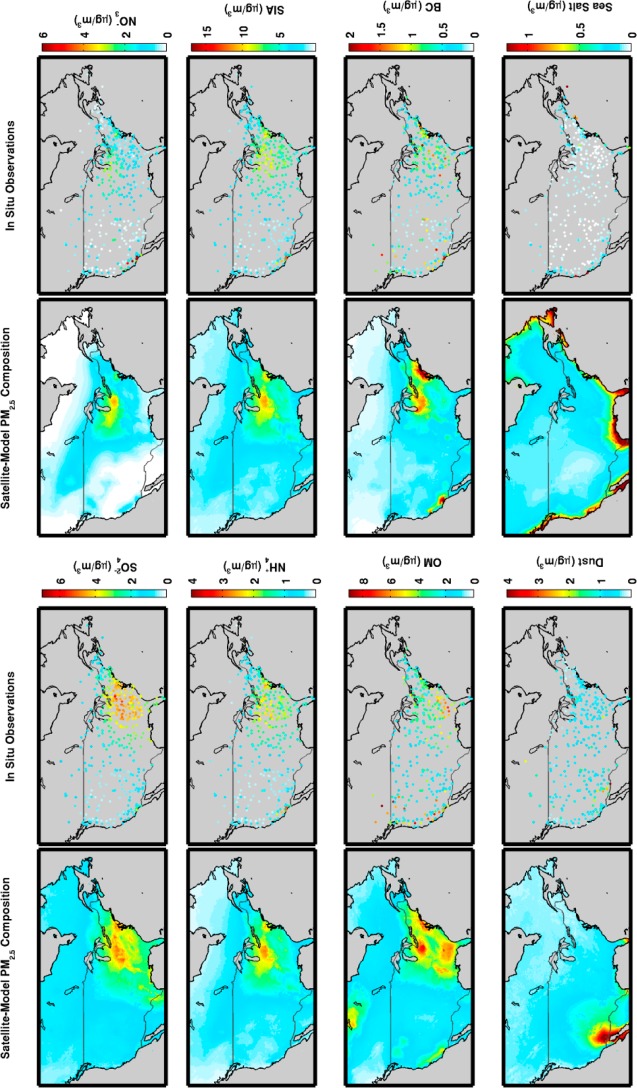
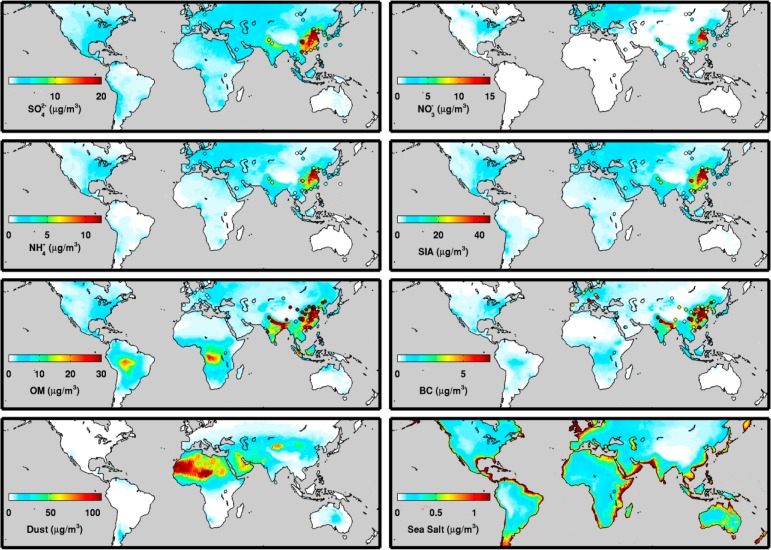
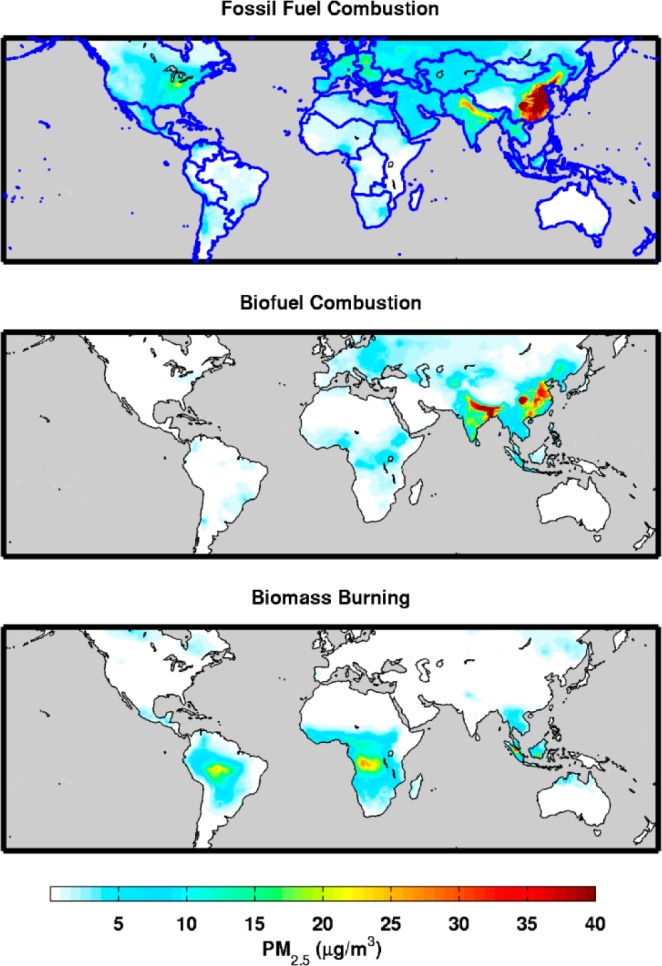
Epidemiologic and health impact studies are inhibited by the paucity of global, long-term measurements of the chemical composition of fine particulate matter. We inferred PM2.5 chemical composition at 0.1° × 0.1° spatial resolution for 2004-2008 by combining aerosol optical depth retrieved from the MODIS and MISR satellite instruments, with coincident profile and composition information from the GEOS-Chem global chemical transport model. Evaluation of the satellite-model PM2.5 composition data set with North American in situ measurements indicated significant spatial agreement for secondary inorganic aerosol, particulate organic mass, black carbon, mineral dust, and sea salt. We found that global population-weighted PM2.5 concentrations were dominated by particulate organic mass (11.9 ± 7.3 μg/m(3)), secondary inorganic aerosol (11.1 ± 5.0 μg/m(3)), and mineral dust (11.1 ± 7.9 μg/m(3)). Secondary inorganic PM2.5 concentrations exceeded 30 μg/m(3) over East China. Sensitivity simulations suggested that population-weighted ambient PM2.5 from biofuel burning (11 μg/m(3)) could be almost as large as from fossil fuel combustion sources (17 μg/m(3)). These estimates offer information about global population exposure to the chemical components and sources of PM2.5.
Figures
References
-
- Kim S.; Peel J. L.; Hannigan M. P.; Dutton S. J.; Sheppard L.; Clark M. L.; Vedal S. The temporal lag structure of short-term associations of fine particulate matter chemical constituents and cardiovascular and respiratory hospitalizations. Environ. Health Perspect. 2012, 12081094–109910.1289/ehp.1104721. - DOI - PMC - PubMed
-
- Burnett R. T.; Brook J.; Dann T.; Delocla C.; Philips O.; Cakmak S.; Vincent R.; Goldberg M. S.; Krewski D. Association between particulate- and gas-phase components of urban air pollution and daily mortality in eight Canadian cities. Inhalation Toxicol. 2000, 12, 15–3910.1080/08958370050164851. - DOI - PubMed
-
- Ostro B.; Lipsett M.; Reynolds P.; Goldberg D.; Hertz A.; Garcia C.; Henderson K. D.; Bernstein L. Long-term exposure to constituents of fine particulate air pollution and mortality: results from the California teachers study. Environ. Health Perspect. 2010, 1183363–36910.1289/ehp.0901181. - DOI - PMC - PubMed
Publication types
MeSH terms
Substances
LinkOut - more resources
Full Text Sources
Other Literature Sources
