. 2015 Feb;123(2):135-43.
doi: 10.1289/ehp.1408646. Epub 2014 Oct 24.

Use of satellite observations for long-term exposure assessment of global concentrations of fine particulate matter

Affiliations

Use of satellite observations for long-term exposure assessment of global concentrations of fine particulate matter

Aaron van Donkelaar et al. Environ Health Perspect. 2015 Feb.

Abstract

Background: More than a decade of satellite observations offers global information about the trend and magnitude of human exposure to fine particulate matter (PM2.5).

Objective: In this study, we developed improved global exposure estimates of ambient PM2.5 mass and trend using PM2.5 concentrations inferred from multiple satellite instruments.

Methods: We combined three satellite-derived PM2.5 sources to produce global PM2.5 estimates at about 10 km × 10 km from 1998 through 2012. For each source, we related total column retrievals of aerosol optical depth to near-ground PM2.5 using the GEOS-Chem chemical transport model to represent local aerosol optical properties and vertical profiles. We collected 210 global ground-based PM2.5 observations from the literature to evaluate our satellite-based estimates with values measured in areas other than North America and Europe.

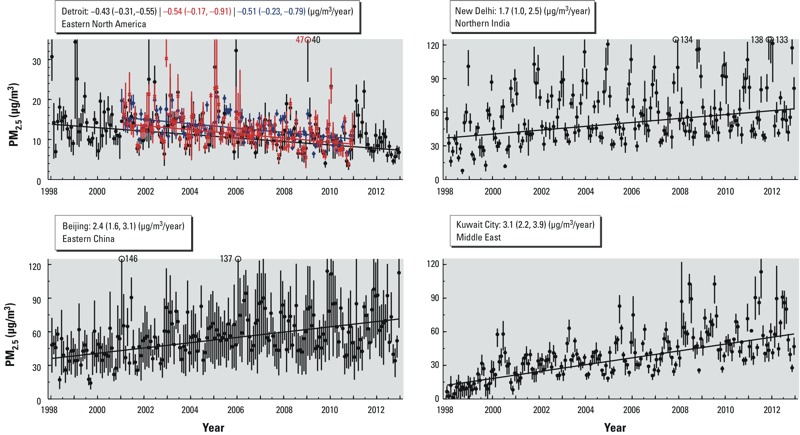
Results: We estimated that global population-weighted ambient PM2.5 concentrations increased 0.55 μg/m3/year (95% CI: 0.43, 0.67) (2.1%/year; 95% CI: 1.6, 2.6) from 1998 through 2012. Increasing PM2.5 in some developing regions drove this global change, despite decreasing PM2.5 in some developed regions. The estimated proportion of the population of East Asia living above the World Health Organization (WHO) Interim Target-1 of 35 μg/m3 increased from 51% in 1998-2000 to 70% in 2010-2012. In contrast, the North American proportion above the WHO Air Quality Guideline of 10 μg/m3 fell from 62% in 1998-2000 to 19% in 2010-2012. We found significant agreement between satellite-derived estimates and ground-based measurements outside North America and Europe (r = 0.81; n = 210; slope = 0.68). The low bias in satellite-derived estimates suggests that true global concentrations could be even greater.

Conclusions: Satellite observations provide insight into global long-term changes in ambient PM2.5 concentrations. Satellite-derived estimates and ground-based PM2.5 observations from this study are available for public use.


Conflict of interest statement

The authors declare they have no actual or potential competing financial interests.

Figures

Figure 1
Figure 1
Decadal (2001–2010) mean PM2.5 concentrations over North America. White areas denote water or missing values. The top panel displays satellite-derived values. The lower right panel contains averages at ground-based sites in operation at least 8 years during this period. The lower left panel provides a scatterplot and statistics (slope = 0.96; r = 0.76; n = 974; 1‑σ error = 1 μg/m3 + 16%) of the two data sets. The 1:1 line is solid. The line of best fit is dash–dot. The observed 1-σ error is dotted. Ground-based and satellite values are not coincidently sampled to avoid biasing the data toward clear-sky conditions when satellite retrievals occur. Numeric data for GBD regional means are provided in Table 1. A common, logarithmic color scale is used for Figures 1–4.
Figure 2
Figure 2
Decadal (2001–2010) mean PM2.5 concentrations over Europe. The top panel displays satellite-derived values. The lower right panel contains ground-based values in operation at least 3 years during this period. The lower left panel provides a scatterplot and statistics (slope = 0.78; r = 0.73; n = 512; 1‑σ error = 1 μg/m3 + 21%) of the two data sets, sampled on the same years but noncoincidently on a daily basis. The 1:1 line is solid. The line of best fit is dash–dot. The observed 1-σ error is dotted. Numeric data for GBD regional means are provided in Table 1. A common, logarithmic color scale is used for Figures 1–4.
Figure 3
Figure 3
Global decadal (2001–2010) mean PM2.5 concentrations. The top panel displays satellite-derived PM2.5. The middle panel contains mineral dust– and sea salt–free PM2.5. Inset maps display GBD regional population-weighted mean concentrations. Numeric data for GBD regional means are provided in Table 1. The bottom right panel shows the 210 global mean ground-level PM2.5 measurements collected from the literature for locations outside Canada, the United States, and Europe. The lower left panel provides a scatterplot and statistics (slope = 0.68; r = 0.81; n = 210; 1‑σ error = 1 μg/m3 + 47%) of the two all-species data sets, sampled on the same years. The 1:1 line is solid. The line of best fit is dash–dot. The observed 1-σ error is dotted. A common, logarithmic color scale is used for Figures 1–4.
Figure 4
Figure 4
Three-year running mean of satellite-derived PM2.5 over sample areas of significant trends. Sub-areas highlighted in Figure 5 are denoted by boxes with black circles around city centers. A common, logarithmic color scale is used for Figures 1–4.
Figure 5
Figure 5
PM2.5 time series at the four sub-areas identified in Figure 4. Black dots and vertical lines denote monthly mean and 25th–75th percentile of satellite-derived values. Corresponding ground-level monitor (red x) and satellite-derived coincident with ground-level monitor (blue diamonds) PM2.5 are also shown for Detroit in the same notation. Trend and 95% CIs based on these values are provided in the keys. Supplemental Material, Figures S4–S6, overlay satellite-derived PM2.5 values with those collected from the literature for Beijing, New Delhi, and Kuwait City.
Figure 6
Figure 6
Cumulative distribution of regional annual mean PM2.5 for 1998–2012. AQG, IT3, IT2, and IT1 refer to the WHO air quality guidelines of 10, 15, 25, and 35 μg/m3.

Comment in

References

    1. Anderson HR, Butland BK, van Donkelaar A, Brauer M, Strachan DP, Clayton T, et al. 2012Satellite-based estimates of ambient air pollution and global variations in childhood asthma prevalence. Environ Health Perspect 1201333–1339.; 10.1289/ehp.1104724 - DOI - PMC - PubMed
    1. Boys B, Martin RV, Van Donkelaar A, MacDonell R, Hsu NC, Cooper MJ, et al. Fifteen year global time series of satellite-derived fine particulate matter. Environ Sci Technol. 2014;48:11109–11118. - PubMed
    1. Brauer M, Amman M, Burnett RT, Cohen A, Dentener FJ, Ezzatti M, et al. Exposure assessment for the estimation of the global burden of disease attributable to outdoor air pollution. Environ Sci Technol. 2012;2012:652–660. - PMC - PubMed
    1. Brown KW, Bouhamra W, Lamoureux DP, Evans JS, Koutrakis P. Characterization of particulate matter for three sites in Kuwait. J Air Waste Manag Assoc. 2008;58:994–1003. - PubMed
    1. Chin M, Diehl T, Tan Q, Prospero JM, Kahn RA, Remer LA, et al. Multi-decadal aerosol variations from 1980 to 2009: a perspective from observations and a global model. Atmos Chem Phys. 2014;14:3657–3690.

Publication types

MeSH terms

LinkOut - more resources