. 2014 Dec 15;307(12):H1777-85.
doi: 10.1152/ajpheart.00341.2014. Epub 2014 Oct 24.

Light phase-restricted feeding slows basal heart rate to exaggerate the type-3 long QT syndrome phenotype in mice

Affiliations

Light phase-restricted feeding slows basal heart rate to exaggerate the type-3 long QT syndrome phenotype in mice

Elizabeth A Schroder et al. Am J Physiol Heart Circ Physiol. .

Abstract

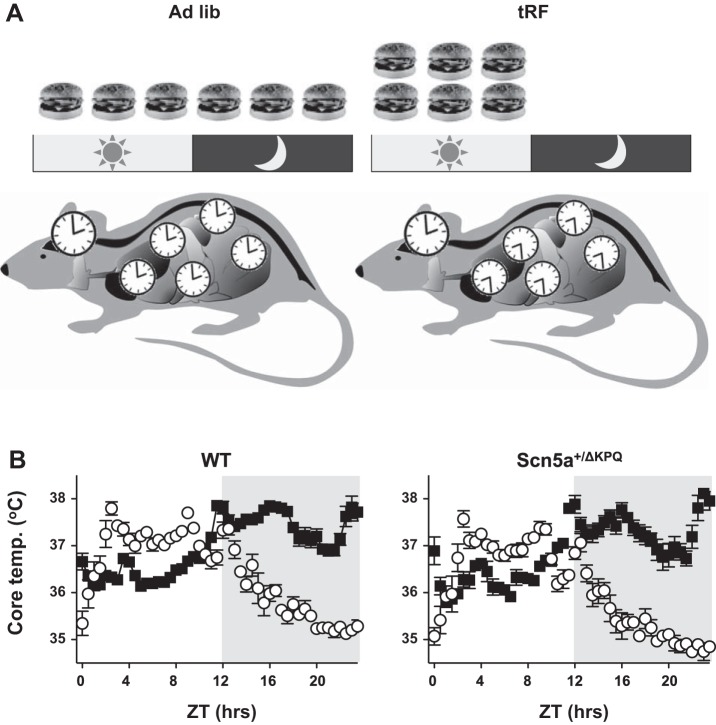
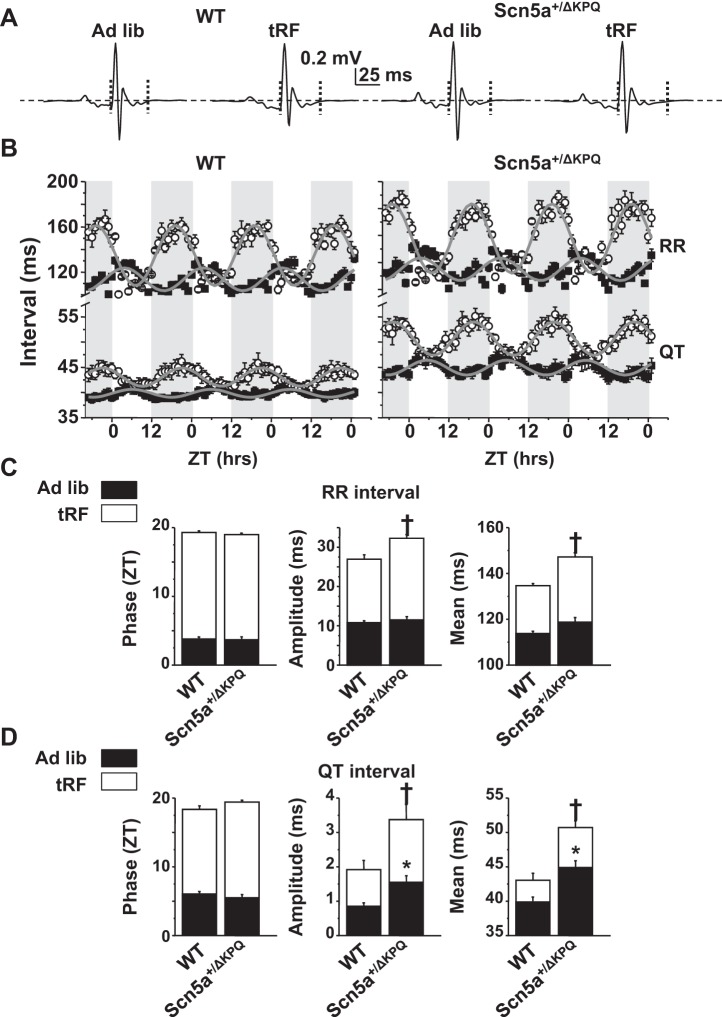
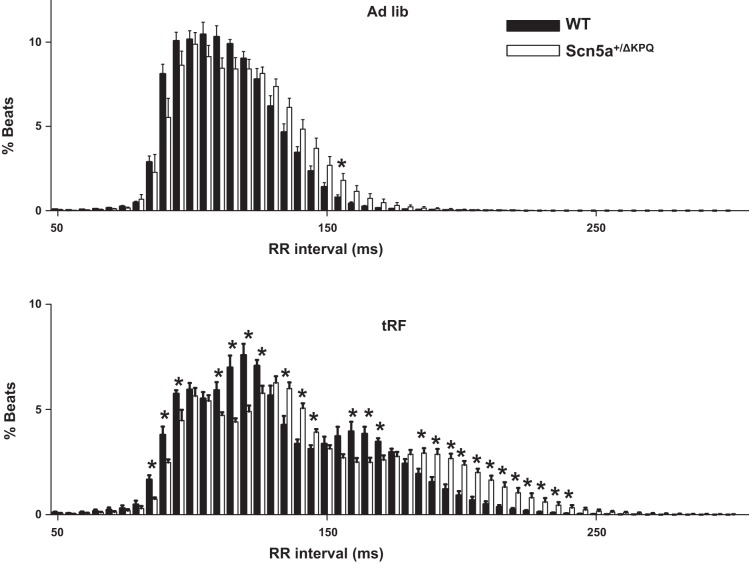
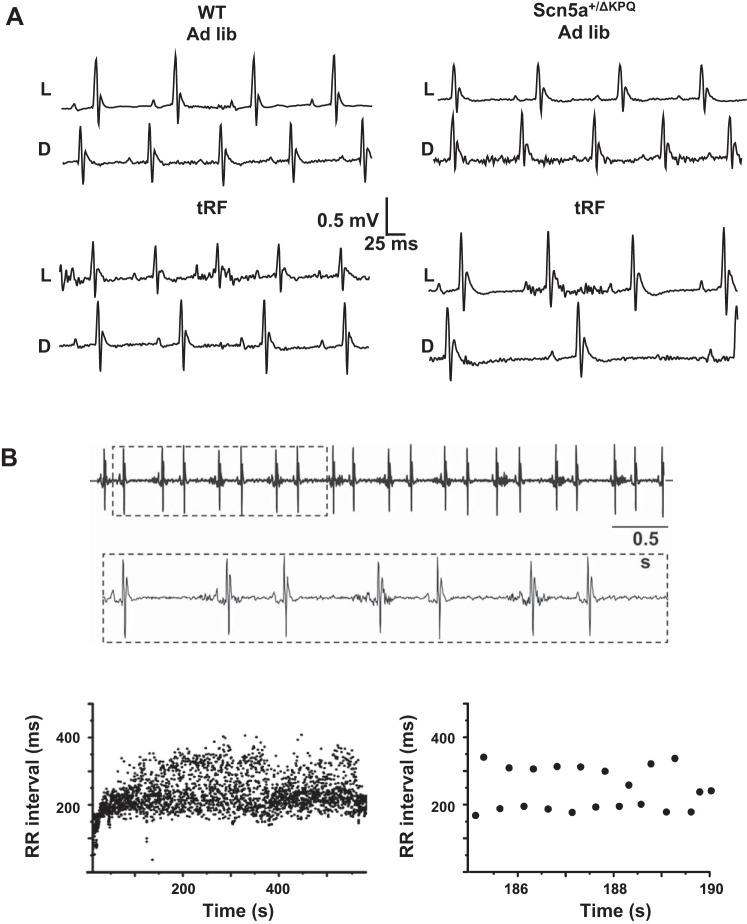
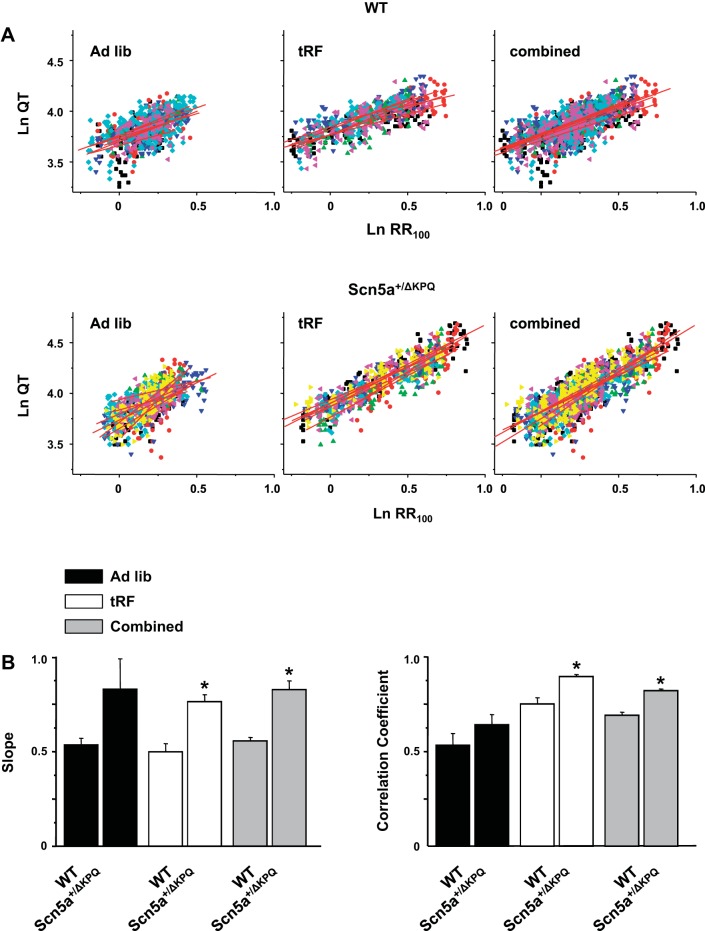
Long QT syndrome type 3 (LQT3) is caused by mutations in the SCN5A-encoded Nav1.5 channel. LQT3 patients exhibit time of day-associated abnormal increases in their heart rate-corrected QT (QTc) intervals and risk for life-threatening episodes. This study determines the effects of uncoupling environmental time cues that entrain circadian rhythms (time of light and time of feeding) on heart rate and ventricular repolarization in wild-type (WT) or transgenic LQT3 mice (Scn5a(+/ΔKPQ)). We used an established light phase-restricted feeding paradigm that disrupts the alignment among the circadian rhythms in the central pacemaker of the suprachiasmatic nucleus and peripheral tissues including heart. Circadian analysis of the RR and QT intervals showed the Scn5a(+/ΔKPQ) mice had QT rhythms with larger amplitudes and 24-h midline means and a more pronounced slowing of the heart rate. For both WT and Scn5a(+/ΔKPQ) mice, light phase-restricted feeding shifted the RR and QT rhythms ~12 h, increased their amplitudes greater than twofold, and raised the 24-h midline mean by ~10%. In contrast to WT mice, the QTc interval in Scn5a(+/ΔKPQ) mice exhibited time-of-day prolongation that was flipped after light phase-restricted feeding. The time-of-day changes in the QTc intervals of Scn5a(+/ΔKPQ) mice were secondary to a steeper power relation between their QT and RR intervals. We conclude that uncoupling time of feeding from normal light cues can dramatically slow heart rate to unmask genotype-specific differences in the QT intervals and aggravate the LQT3-related phenotype.

Keywords: SCN5A; circadian rhythms; feeding; heart rate; long QT syndrome.


Figures

Fig. 1.
Fig. 1.
Light-phase, time-restricted feeding (tRF) shifts the peak of the core body temperature (Temp) to the light phase. A: depiction showing how light phase-restricted feeding selectively influences the timing of peripheral organ metabolism (clocks) relative to the light-dark cycle and the timing of circadian oscillations in the suprachiasmatic nucleus. B: core body temperature data plotted as the half-hour mean for ad libitum (Ad Lib)-fed (■) and tRF conditions (○) for wild-type (WT; left) and Scn5a+/ΔKPQ (right) mice (n = 6 animals each). Zeitgeber time (ZT) = 0 is the onset of the light phase and the shaded region signifies the dark phase.
Fig. 2.
Fig. 2.
Light phase-restricted feeding alters the circadian rhythm of RR and QT intervals in WT and Scn5a+/ΔKPQ mice. A: ECG traces averaged over 1 h for ad libitum-fed or tRF WT and Scn5a+/ΔKPQ mice. Horizontal dashed lines are the zero potential line, and vertical dotted lines denote the averaged trace's QT interval. B: hourly averages in the RR or QT intervals for WT (left) or Scn5a+/ΔKPQ (right) mice in ad libitum-fed (■) or after tRF conditions (○). Averages are plotted as a function of ZT over ∼3 days. Shaded regions denote the dark phases. The gray line is the sinusoidal fit to the data. C: mean phases, amplitudes, and 24-h midline means for the RR. D: QT intervals from the sinusoidal fits to the individual data from WT or Scn5a+/ΔKPQ mice in ad libitum (black bars) or after tRF conditions (white bars). Not denoted is the finding that compared with ad libitum-fed conditions, tRF conditions increased the phase, amplitude, and midline means for both WT and Scn5a+/ΔKPQ mice (n = 6 animals each, P < 0.05). Significance denoted for WT vs. Scn5a+/ΔKPQ mice in ad libitum-fed conditions (*P < 0.05) or tRF (†P < 0.05) conditions.
Fig. 3.
Fig. 3.
Time-restricted feeding unmasks slower RR intervals in the Scn5a+/ΔKPQ mice. Histogram plots for the distribution of RR intervals from WT (black bars) or Scn5a+/ΔKPQ (white bars) mice in ad libitum-fed (top) or tRF conditions (bottom). The RR intervals are separated into 5-ms bins (*P < 0.05; n = 6 animal each).
Fig. 4.
Fig. 4.
Light phase-restricted feeding unmasks ECG differences between WT and Scn5a+/ΔKPQ mice. A: representative ECG traces recorded in WT (left) and Scn5a+/ΔKPQ (right) mice during both light (L) and dark (D) phase in ad libitum (top 2 traces)- or tRF-feeding (bottom 2 traces) conditions. B: small portion of an atrial bigeminy arrhythmia recorded from an Scn5a+/ΔKPQ mouse. Inset: boxed ECG region at a higher resolution. Graphs show beat-to-beat changes in the RR interval measured during on entire episode of a bigeminal arrhythmia (left) or an amplified portion (right) to highlight the alteration in the RR intervals.
Fig. 5.
Fig. 5.
The power of the QT-RR100 relation is steeper for Scn5a+/ΔKPQ mice. A: power of the relation between the QT and RR intervals for the WT (top) or Scn5a+/ΔKPQ (bottom) mice calculated in ad libitum-fed (left), tRF (middle), or combined ad libitum-fed and tRF (right) conditions. Each animal is highlighted as a different colored symbol, and red line shows the corresponding fits (n = 6 to 7 for WT and Scn5a+/ΔKPQ, respectively). B: mean slopes (left) and correlation coefficients (right) for the ad libitum-fed, tRF, or combined conditions (*P < 0.05 for WT vs. Scn5a+/ΔKPQ).

References

    1. Arble DM, Bass J, Laposky AD, Vitaterna MH, Turek FW. Circadian timing of food intake contributes to weight gain. Obesity (Silver Spring) 17: 2100–2102, 2009. - PMC - PubMed
    1. Bachmanov AA, Reed DR, Beauchamp GK, Tordoff MG. Food intake, water intake, and drinking spout side preference of 28 mouse strains. Behav Genet 32: 435–443, 2002. - PMC - PubMed
    1. Batchvarov V, Yi G, Guo X, Savelieva I, Camm AJ, Malik M. QT interval and QT dispersion measured with the threshold method depend on threshold level. Pacing Clin Electrophysiol 21: 2372–2375, 1998. - PubMed
    1. Bray MS, Ratcliffe WF, Grenett MH, Brewer RA, Gamble KL, Young ME. Quantitative analysis of light-phase restricted feeding reveals metabolic dyssynchrony in mice. Int J Obes (Lond) 37: 843–852, 2013. - PMC - PubMed
    1. Calvillo L, Spazzolini C, Vullo E, Insolia R, Crotti L, Schwartz PJ. Propranolol prevents life-threatening arrhythmias in LQT3 transgenic mice: implications for the clinical management of LQT3 patients. Heart Rhythm 11: 126–132, 2014. - PMC - PubMed

Publication types

Substances

LinkOut - more resources