. 2014 Oct 25:11:182.
doi: 10.1186/s12974-014-0182-7.

Quantitative assessment of microglial morphology and density reveals remarkable consistency in the distribution and morphology of cells within the healthy prefrontal cortex of the rat

Quantitative assessment of microglial morphology and density reveals remarkable consistency in the distribution and morphology of cells within the healthy prefrontal cortex of the rat

Ratchaniporn Kongsui et al. J Neuroinflammation. .

Abstract

Background: Microglial morphology within the healthy brain has been the subject of a number of observational studies. These have suggested that microglia may consist of separate classes, which possess substantially different morphological features. Critically, there have been no systematic quantitative studies of microglial morphology within the healthy brain.

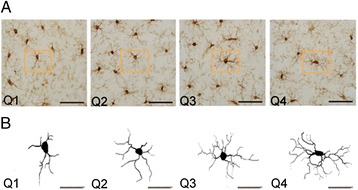
Methods: We examined microglial cells within the adult rat prefrontal cortex. At high magnification, digital reconstructions of cells labelled with the microglial-specific marker ionized calcium-binding adapter molecule-1 (Iba-1) were made in each of the cortical layers. These reconstructions were subsequently analyzed to determine the convex hull area of the cells, their somal perimeter, the length of processes, the number of processes, the extent of process branching and the volume of processes. We additionally examined whether cells' morphological features were associated with cell size or numerical density.

Results: Our analysis indicated that while there was substantial variability in the size of cells within the prefrontal cortex, cellular morphology was extremely consistent within each of the cortical layers.

Conclusions: Our results provide quantitative confirmation that microglia are largely homogenous in the uninjured rodent prefrontal cortex.


Figures

Figure 1
Figure 1
Microglia in the prefrontal cortex. (A) Cells were imaged using a 100× objective on a Zeiss AxioSkop if their processes could be fully visualized within the given section. (B) Imaged cells were traced and ordered according to size (smallest to largest, Q1 to Q4). Scale bars =20 μm.
Figure 2
Figure 2
Microglial morphology is consistent across cortical layers of the prefrontal cortex. Sholl analysis of microglia according to cortical layer location yielded regular patterns of morphological characteristics. Maxima for all measures were observed approximately 15 μm from the soma, followed by steady tapering in size and complexity. Values are expressed as mean ± standard error of the mean.
Figure 3
Figure 3
Microglia in the prefrontal cortex have a wide range of sizes. A frequency histogram of all microglial cells sampled revealed a right-tailed distribution with a range of approximately 3,000 μm2.
Figure 4
Figure 4
Microglial size affects the extent of ramification. Bivariate correlation of morphological characteristics with overall microglial cell size revealed that increasing cell size directly correlated with an increase in process size and complexity. * P <0.05.
Figure 5
Figure 5
Microglial cell size affects overall process characteristics. Sholl analysis of microglial cells divided into quartiles on the basis of size revealed a marked increase in process complexity as cell size increased. Overall differences by group were determined from the trapezoidal area under each Sholl curve (inset graphs). Black circles, Q1; white circles, Q2; black triangles, Q3; white triangles, Q4; * P <0.05; ** P <0.01; *** P <0.001.
Figure 6
Figure 6
Heat maps demonstrating microglial representation in prefrontal cortex, Bregma +2.5 mm. Absolute cell counts of microglia yielded x-y coordinates for each cell. (A) Coordinates were converted into representative heat maps for the region, which was divided into a 3 × 5 grid for analysis of population differences. The point (0, 0) represents the most ventral point on the pial surface of the prefrontal cortex. Red indicates relatively heavily populated regions while blue indicates relatively lightly populated regions. (B) Two-dimensional representation of microglial population.

References

    1. Streit WJ, Mrak RE, Griffin WS. Microglia and neuroinflammation: a pathological perspective. J Neuroinflammation. 2004;1(1):14. doi: 10.1186/1742-2094-1-14. - DOI - PMC - PubMed
    1. Yong VW, Rivest S. Taking advantage of the systemic immune system to cure brain diseases. Neuron. 2009;64(1):55–60. doi: 10.1016/j.neuron.2009.09.035. - DOI - PubMed
    1. Gao HM, Hong JS. Why neurodegenerative diseases are progressive: uncontrolled inflammation drives disease progression. Trends Immunol. 2008;29(8):357–365. doi: 10.1016/j.it.2008.05.002. - DOI - PMC - PubMed
    1. Napoli I, Neumann H. Microglial clearance function in health and disease. Neuroscience. 2009;158(3):1030–1038. doi: 10.1016/j.neuroscience.2008.06.046. - DOI - PubMed
    1. Graeber MB. Changing face of microglia. Science. 2010;330(6005):783–788. doi: 10.1126/science.1190929. - DOI - PubMed

LinkOut - more resources