. 2015 Mar 1;24(5):1305-21.
doi: 10.1093/hmg/ddu541. Epub 2014 Oct 24.

Expression of progerin in aging mouse brains reveals structural nuclear abnormalities without detectible significant alterations in gene expression, hippocampal stem cells or behavior

Affiliations

Expression of progerin in aging mouse brains reveals structural nuclear abnormalities without detectible significant alterations in gene expression, hippocampal stem cells or behavior

Jean-Ha Baek et al. Hum Mol Genet. .

Abstract

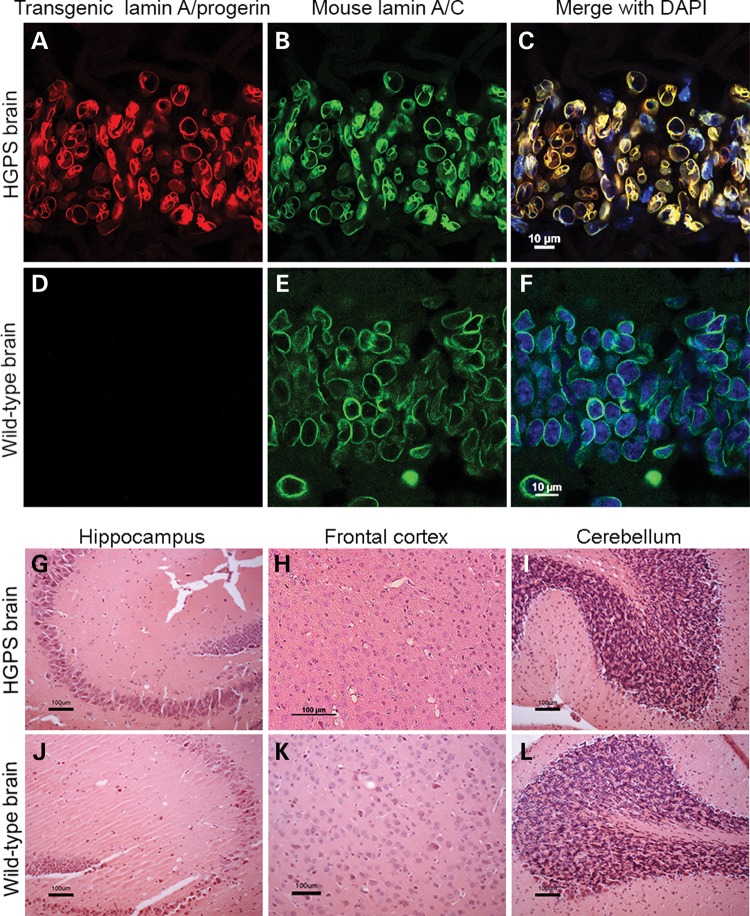
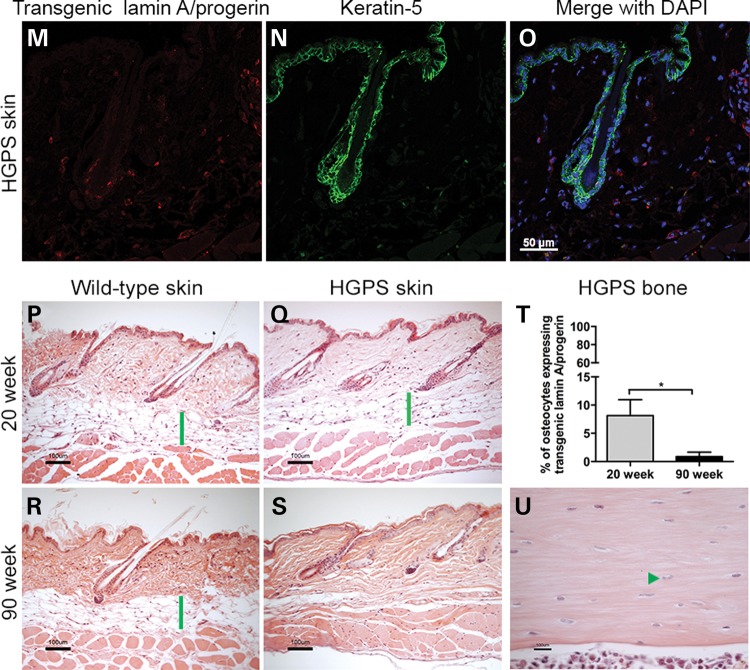
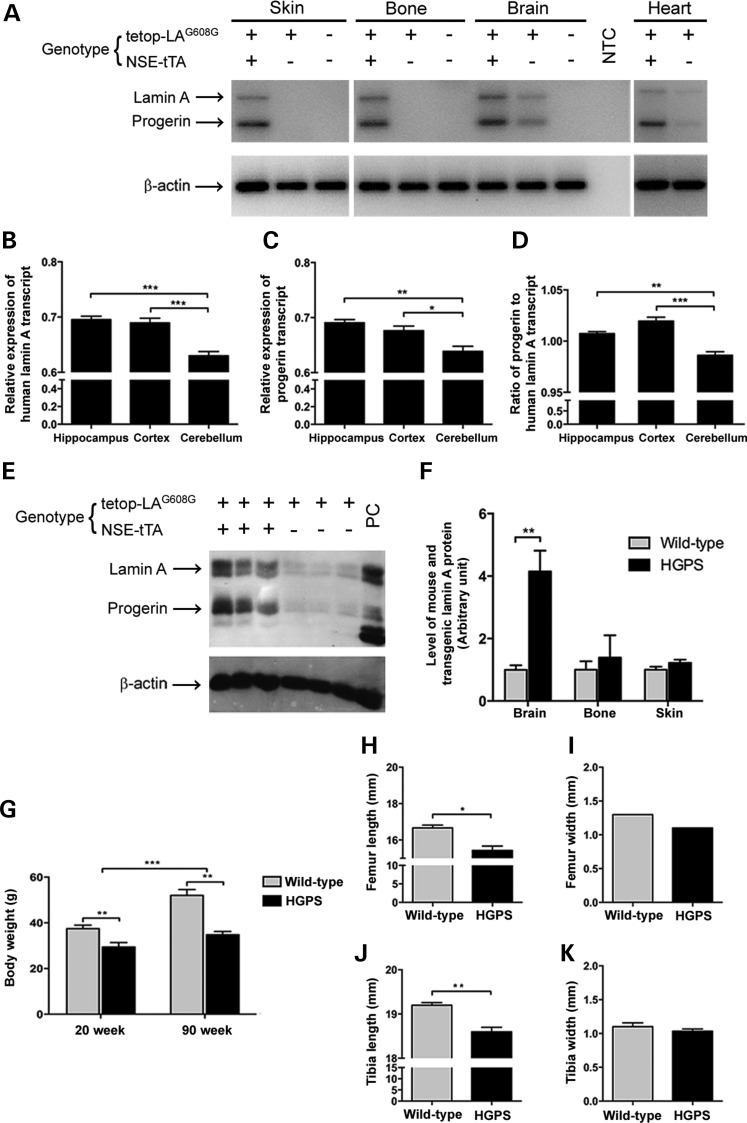
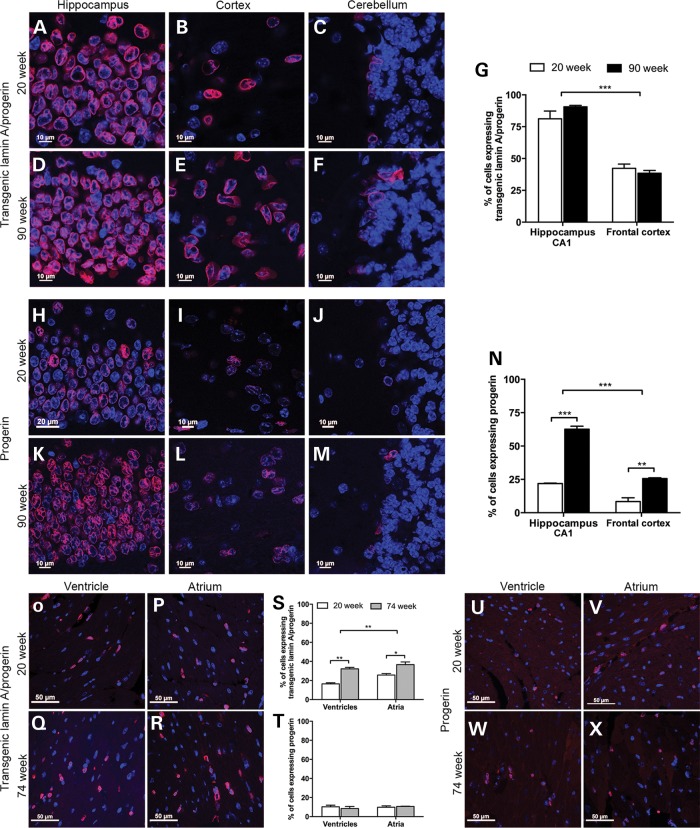
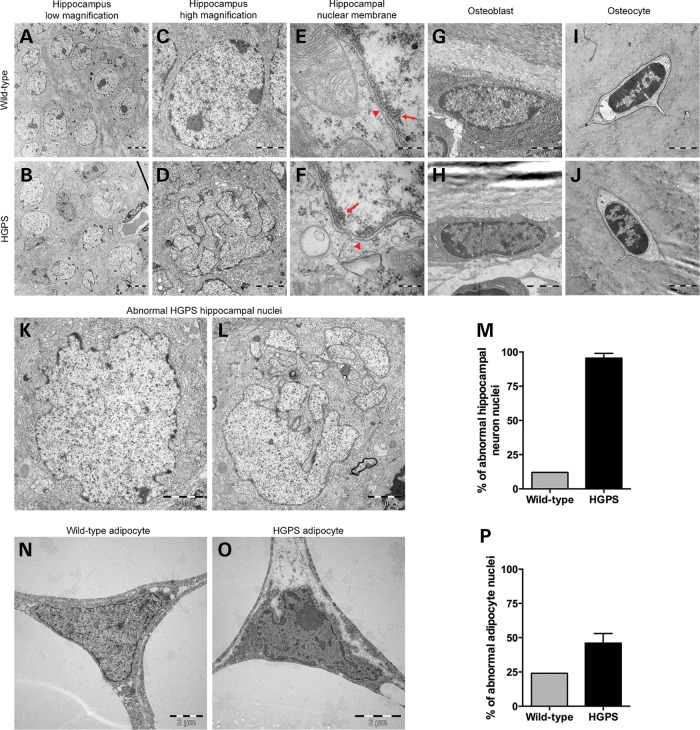
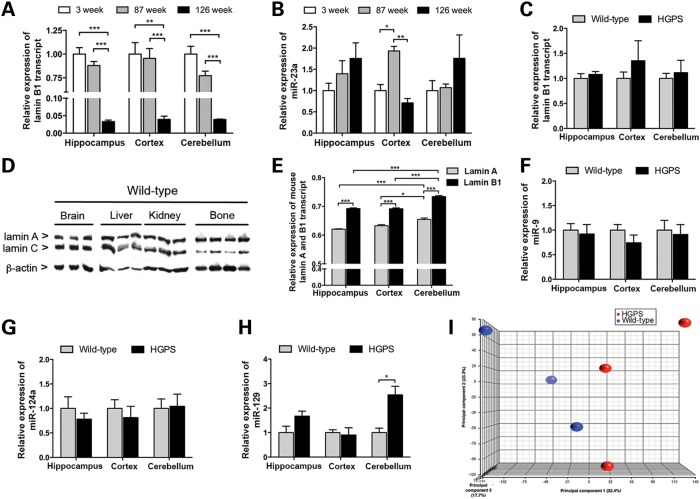
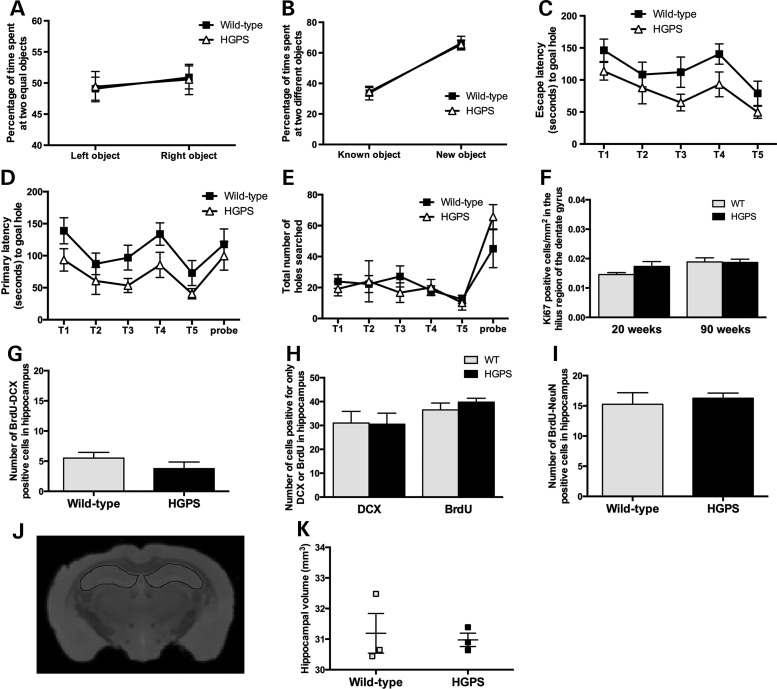
Hutchinson-Gilford progeria syndrome (HGPS) is a segmental progeroid syndrome with multiple features suggestive of premature accelerated aging. Accumulation of progerin is thought to underlie the pathophysiology of HGPS. However, despite ubiquitous expression of lamin A in all differentiated cells, the HGPS mutation results in organ-specific defects. For example, bone and skin are strongly affected by HGPS, while the brain appears to be unaffected. There are no definite explanations as to the variable sensitivity to progeria disease among different organs. In addition, low levels of progerin have also been found in several tissues from normal individuals, but it is not clear if low levels of progerin contribute to the aging of the brain. In an attempt to clarify the origin of this phenomenon, we have developed an inducible transgenic mouse model with expression of the most common HGPS mutation in brain, skin, bone and heart to investigate how the mutation affects these organs. Ultrastructural analysis of neuronal nuclei after 70 weeks of expression of the LMNA c.1824C>T mutation showed severe distortion with multiple lobulations and irregular extensions. Despite severe distortions in the nuclei of hippocampal neurons of HGPS animals, there were only negligible changes in gene expression after 63 weeks of transgenic expression. Behavioral analysis and neurogenesis assays, following long-term expression of the HGPS mutation, did not reveal significant pathology. Our results suggest that certain tissues are protected from functional deleterious effects of progerin.


Figures

Figure 1.
Figure 1.
Expression pattern of the transgenic lamin A/progerin in brain, skin and bone and subsequent histopathological analyses. (AF) Immunofluorescent labeling of 90-week CA1 hippocampal brain regions from HGPS and wild-type animals. (GL) Hematoxylin and eosin staining showed no noticeable pathology in various regions of the brain in 90-week HGPS animals compared with wild-type animals. Representative images from hippocampus (CA3 region), frontal cortex and cerebellum. (MO) Immunofluorescent labeling of 20-week skin showed that transgenic lamin A/progerin expression was observed in keratinocytes of the proximal part of the bulb of the hair follicle, scattered fibroblast-like cells in the dermis and cells of the hypodermis. (PS) Skin tissues stained with hematoxylin and eosin showed that the hypodermal layer (green bars), which is used to store subcutaneous fat, was lost in the 90-week HGPS animals. (T) Percentage of osteocytes that expressed the transgenic lamin A/progerin in femur from 20- and 90-week-old HGPS animals. (U) Hematoxylin and eosin staining of the femur from 90-week-old HGPS animals with osteocytes in most lacunae (arrowhead) and a healthy bone marrow. Values represent mean ± SEM (*P < 0.05).
Figure 1.
Figure 1.
Expression pattern of the transgenic lamin A/progerin in brain, skin and bone and subsequent histopathological analyses. (AF) Immunofluorescent labeling of 90-week CA1 hippocampal brain regions from HGPS and wild-type animals. (GL) Hematoxylin and eosin staining showed no noticeable pathology in various regions of the brain in 90-week HGPS animals compared with wild-type animals. Representative images from hippocampus (CA3 region), frontal cortex and cerebellum. (MO) Immunofluorescent labeling of 20-week skin showed that transgenic lamin A/progerin expression was observed in keratinocytes of the proximal part of the bulb of the hair follicle, scattered fibroblast-like cells in the dermis and cells of the hypodermis. (PS) Skin tissues stained with hematoxylin and eosin showed that the hypodermal layer (green bars), which is used to store subcutaneous fat, was lost in the 90-week HGPS animals. (T) Percentage of osteocytes that expressed the transgenic lamin A/progerin in femur from 20- and 90-week-old HGPS animals. (U) Hematoxylin and eosin staining of the femur from 90-week-old HGPS animals with osteocytes in most lacunae (arrowhead) and a healthy bone marrow. Values represent mean ± SEM (*P < 0.05).
Figure 2.
Figure 2.
Transgenic lamin A/progerin expression in mouse. (A) RT-PCR of skin, bone, brain and heart tissues from HGPS, single transgenic and wild-type mice using a human lamin A and progerin-specific assay. Presence or absence of the transgene is indicated with + or –, respectively. (BD) Relative transcript level of human lamin A and progerin in three different regions of the brain: hippocampus, cortex and cerebellum. (E) Western blot analysis of protein extracts from mouse brain tissue using a transgene-specific lamin antibody (anti-human lamin A/C, clone JoL2). Protein extracts from a HGPS patient were loaded as a positive control (PC). (F) Quantification of relative protein levels using densitometry. (G) Body weights of the HGPS and wild-type animals. (HK) Bone length and width in HGPS compared with wild-type animals. NTC, no template control. Values represent mean ± SEM (*P < 0.05, **P < 0.01–0.001, ***P < 0.001).
Figure 3.
Figure 3.
Quantification of the transgenic lamin A/progerin and progerin expression in the brain and heart. (AF) Immunofluorescent labeling of transgenic lamin A/progerin in three different regions of the brain, including the CA1 region of hippocampus, frontal cortex and the Purkinje cell layer of the cerebellum, of the HGPS animals. For both age groups, almost all cells were positive for the transgenic lamin A/progerin in the hippocampus, while in the cerebellum, there were very few positive cells. (G) Quantification of transgene-positive cells in the CA1 region of the hippocampus and the frontal cortex. (HM) Immunofluorescent labeling of progerin in three different regions of the brain of HGPS animals. (N) Quantification of progerin-positive cells in the CA1 region of the hippocampus and the frontal cortex. (OR) Immunofluorescent labeling of transgenic lamin A/progerin in the heart from HGPS animals at 20 or 74 weeks of age. (S and T) Quantification of cells expressing transgenic lamin A/progerin or progerin. (UX) Immunofluorescent labeling of progerin in the ventricles and atria from the HGPS animals. Images of immunofluorescent staining were merged with DAPI. Values represent mean ± SEM (*P < 0.05, **P < 0.01–0.001, ***P < 0.001).
Figure 4.
Figure 4.
Electron microscopic analyses of nuclei of various cell types from 70-week HGPS and wild-type animals. While the wild-type hippocampus nuclei from the CA1 region consistently had a smooth round shape (A and C), the HGPS hippocampal nuclei of the CA1 region had a very irregular shape (B and K) and presented with extensive folding, blebbing and lobulation of the nuclear envelope, which was so severe that the nuclei looked fragmented (D and L). The images from the nuclear membranes (arrowheads; E and F) of the hippocampal neurons in the wild-type (E) and HGPS (F) animals showed no apparent loss of heterochromatin (arrows). (G–J) There were no significant differences in the nuclear structure of osteoblasts or osteocytes. (M) Quantification of abnormal nuclei in the hippocampus showed that 95.5% of hippocampal neurons had abnormal nuclei, compared with 11% in wild-type animals. (N and O) Nuclei of adipocytes from HGPS animals showed moderate folding and irregularity in nuclear morphology compared with wild-type animals. (P) Quantification of the percentage of adipocytes with abnormal nuclei morphology.
Figure 5.
Figure 5.
Gene expression and miRNA analyses of different regions of the brain in HGPS and wild-type animals. (A and B) Graphs showing the relative expression of lamin B1 transcript (A) and miR-23a (B) in various regions of the brain from wild-type animals at 3, 83 and 126 weeks of age. (C) Lamin B1 transcript levels in HGPS animals compared with wild-type animals. (D) Western blot showing the expression of mouse lamin A and C in brain, liver, kidney and tail-bone tissues from adult wild-type animals. The sc-6215 antibody was used to detect the lamin A and C proteins. (E) Relative expression level of mouse lamin A and B1 transcripts in various regions of the brain in 20-week-old wild-type animals. (FH) Relative expression of miR-9 (F), miR-124a (G) and miR-129 (H) in various regions of the brain of 20-week HGPS and wild-type animals. (I) Principal component analysis of the top 1000 genes with the highest average expression levels revealed very small changes in gene expression in the hippocampi of HGPS animals (red) compared with wild-type (blue). Values represent mean ± SEM (*P < 0.05, **P < 0.01–0.001, ***P < 0.001).
Figure 6.
Figure 6.
Functional analysis of hippocampus and neurogenesis in HGPS animals. (A and B) Object memory consolidation. (A) Pre-trial with two identical objects (left and right). Fraction of the time spent at each object on the ordinate, while object position is displayed on the abscissa. Key to genotype can be found in A. (B) Probe trial with familiar and novel objects. Both groups show a preference for the novel object (paired t-test; P < 0.001). The mean and SEM have been indicated. (CE) Barnes maze test on spatial memory and learning. (C) The escape latency decreases across trials (T1–T5) in parallel with an improvement in primary latency (first encounter with correct hole) shown in (D) and the decrease in total number of holes searched in each trial (E). The improvement in escape latency across trials was evident within animals (F = 6.3; P < 0.001) but not between animal groups (F = 4.0; P = 0.07); thus, the slightly better performance of the HGPS line did not reach statistical significance. (F) No difference was detected between HGPS and wild-type animals at both 20 and 90 weeks of hippocampal cell proliferation. (GI) Adult neurogenesis in HGPS and wild-type animals measured by double labeling with BrdU/DCX (G and H), BrdU/NeuN (I). (J) Hippocampal volumes were manually outlined using the ITK-SNAP software. A representative MRI image illustrating segmentation of the hippocampus from HGPS mice is outlined in the figure. (K) No significant difference, indicative of hippocampal atrophy, was seen between HGPS and wild-type mice. The mean and SEM have been indicated.

References

    1. Baek J.-H., McKenna T., Eriksson M. Hutchinson–Gilford progeria syndrome. In: Puiu M., editor. Genetic Disorders. Vol. 1. Croatia: InTech, Rijeka; 2012. pp. 65–87.
    1. Merideth M.A., Gordon L.B., Clauss S., Sachdev V., Smith A.C., Perry M.B., Brewer C.C., Zalewski C., Kim H.J., Solomon B., et al. Phenotype and course of Hutchinson–Gilford progeria syndrome. N. Engl. J. Med. 2008;358:592–604. - PMC - PubMed
    1. De Sandre-Giovannoli A., Bernard R., Cau P., Navarro C., Amiel J., Boccaccio I., Lyonnet S., Stewart C.L., Munnich A., Le Merrer M., et al. Lamin a truncation in Hutchinson–Gilford progeria. Science. 2003;300:2055. - PubMed
    1. Eriksson M., Brown W.T., Gordon L.B., Glynn M.W., Singer J., Scott L., Erdos M.R., Robbins C.M., Moses T.Y., Berglund P., et al. Recurrent de novo point mutations in lamin A cause Hutchinson–Gilford progeria syndrome. Nature. 2003;423:293–298. - PMC - PubMed
    1. Goldman R.D., Shumaker D.K., Erdos M.R., Eriksson M., Goldman A.E., Gordon L.B., Gruenbaum Y., Khuon S., Mendez M., Varga R., et al. Accumulation of mutant lamin A causes progressive changes in nuclear architecture in Hutchinson–Gilford progeria syndrome. Proc. Natl. Acad. Sci. USA. 2004;101:8963–8968. - PMC - PubMed

Publication types

MeSH terms