Quantitative in vivo immunohistochemistry of epidermal growth factor receptor using a receptor concentration imaging approach
- PMID: 25344226
- PMCID: PMC4268352
- DOI: 10.1158/0008-5472.CAN-14-0141
Quantitative in vivo immunohistochemistry of epidermal growth factor receptor using a receptor concentration imaging approach
Abstract
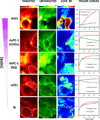
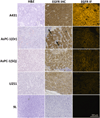
As receptor-targeted therapeutics become increasingly used in clinical oncology, the ability to quantify protein expression and pharmacokinetics in vivo is imperative to ensure successful individualized treatment plans. Current standards for receptor analysis are performed on extracted tissues. These measurements are static and often physiologically irrelevant; therefore, only a partial picture of available receptors for drug targeting in vivo is provided. Until recently, in vivo measurements were limited by the inability to separate delivery, binding, and retention effects, but this can be circumvented by a dual-tracer approach for referencing the detected signal. We hypothesized that in vivo receptor concentration imaging (RCI) would be superior to ex vivo immunohistochemistry (IHC). Using multiple xenograft tumor models with varying EGFR expression, we determined the EGFR concentration in each model using a novel targeted agent (anti-EGFR affibody-IRDye800CW conjugate) along with a simultaneously delivered reference agent (control affibody-IRDye680RD conjugate). The RCI-calculated in vivo receptor concentration was strongly correlated with ex vivo pathologist-scored IHC and computer-quantified ex vivo immunofluorescence. In contrast, no correlation was observed with ex vivo Western blot analysis or in vitro flow-cytometry assays. Overall, our results argue that in vivo RCI provides a robust measure of receptor expression equivalent to ex vivo immunostaining, with implications for use in noninvasive monitoring of therapy or therapeutic guidance during surgery.
©2014 American Association for Cancer Research.
Conflict of interest statement
Figures


Similar articles
-
Imaging of EGFR expression in murine xenografts using site-specifically labelled anti-EGFR 111In-DOTA-Z EGFR:2377 Affibody molecule: aspect of the injected tracer amount.Eur J Nucl Med Mol Imaging. 2010 Mar;37(3):613-22. doi: 10.1007/s00259-009-1283-x. Epub 2009 Oct 17. Eur J Nucl Med Mol Imaging. 2010. PMID: 19838701
-
Near infrared imaging of epidermal growth factor receptor positive xenografts in mice with domain I/II specific antibody fragments.Theranostics. 2019 Jan 30;9(4):974-985. doi: 10.7150/thno.30835. eCollection 2019. Theranostics. 2019. PMID: 30867810 Free PMC article.
-
Noninvasive quantification of target availability during therapy using paired-agent fluorescence tomography.Theranostics. 2020 Sep 14;10(24):11230-11243. doi: 10.7150/thno.45273. eCollection 2020. Theranostics. 2020. PMID: 33042280 Free PMC article.
-
Analysis of Progress and Challenges of EGFR-Targeted Molecular Imaging in Cancer With a Focus on Affibody Molecules.Mol Imaging. 2019 Jan-Dec;18:1536012118823473. doi: 10.1177/1536012118823473. Mol Imaging. 2019. PMID: 30799684 Free PMC article. Review.
-
Molecular imaging of EGFR/HER2 cancer biomarkers by protein MRI contrast agents.J Biol Inorg Chem. 2014 Feb;19(2):259-70. doi: 10.1007/s00775-013-1076-3. Epub 2013 Dec 24. J Biol Inorg Chem. 2014. PMID: 24366655 Free PMC article. Review.
Cited by
-
Macroscopic Fluorescence Lifetime Imaging for Monitoring of Drug-Target Engagement.Methods Mol Biol. 2022;2394:837-856. doi: 10.1007/978-1-0716-1811-0_44. Methods Mol Biol. 2022. PMID: 35094361 Free PMC article.
-
Modeling the binding and diffusion of receptor-targeted nanoparticles topically applied on fresh tissue specimens.Phys Med Biol. 2019 Feb 18;64(4):045013. doi: 10.1088/1361-6560/aaff81. Phys Med Biol. 2019. PMID: 30654346 Free PMC article.
-
Quantitative Impact of Plasma Clearance and Down-regulation on GLP-1 Receptor Molecular Imaging.Mol Imaging Biol. 2016 Feb;18(1):79-89. doi: 10.1007/s11307-015-0880-2. Mol Imaging Biol. 2016. PMID: 26194012 Free PMC article.
-
Image-derived arterial input function for quantitative fluorescence imaging of receptor-drug binding in vivo.J Biophotonics. 2016 Mar;9(3):282-95. doi: 10.1002/jbio.201500162. Epub 2015 Sep 9. J Biophotonics. 2016. PMID: 26349671 Free PMC article.
-
Paired-agent imaging for detection of head and neck cancers.Proc SPIE Int Soc Opt Eng. 2019 Feb;10853:108530P. doi: 10.1117/12.2510897. Epub 2019 Feb 26. Proc SPIE Int Soc Opt Eng. 2019. PMID: 31686720 Free PMC article.
References
-
- Mankoff DA, Link JM, Linden HM, Sundararajan L, Krohn KA. Tumor Receptor Imaging. Journal of Nuclear Medicine. 2008;49:149S–163S. - PubMed
-
- Ntziachristos V. Fluorescence Molecular Imaging. Annual Review of Biomedical Engineering. 2006;8:1–33. - PubMed
-
- Oyen WJG, Van Der Graaf WTA. Molecular imaging of solid tumors: exploiting the potential. Nature Reviews Clinical Oncology. 2009;6:609–611. - PubMed
-
- Willmann JK, van Bruggen N, Dinkelborg LM, Gambhir SS. Molecular imaging in drug development. Nat Rev Drug Discov. 2008;7:591–607. - PubMed
-
- Rudin M, Weissleder R. Molecular imaging in drug discovery and development. Nat Rev Drug Discov. 2003;2:123–131. - PubMed
Publication types
MeSH terms
Substances
Grants and funding
LinkOut - more resources
Full Text Sources
Other Literature Sources
Research Materials
Miscellaneous

