

Network-based analysis of comorbidities risk during an infection: SARS and HIV case studies
- PMID: 25344230
- PMCID: PMC4363349
- DOI: 10.1186/1471-2105-15-333
Network-based analysis of comorbidities risk during an infection: SARS and HIV case studies
Abstract
Background: Infections are often associated to comorbidity that increases the risk of medical conditions which can lead to further morbidity and mortality. SARS is a threat which is similar to MERS virus, but the comorbidity is the key aspect to underline their different impacts. One UK doctor says "I'd rather have HIV than diabetes" as life expectancy among diabetes patients is lower than that of HIV. However, HIV has a comorbidity impact on the diabetes.
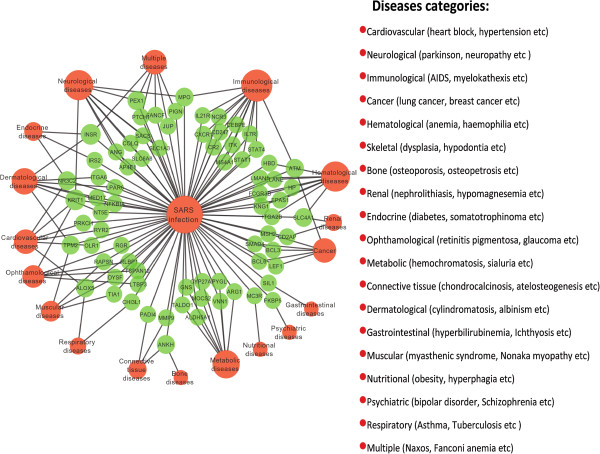
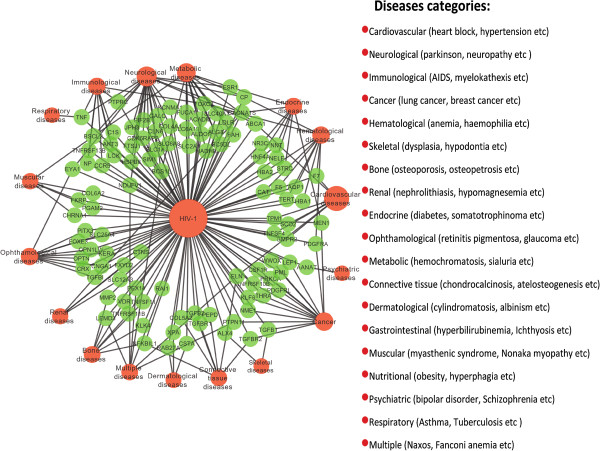
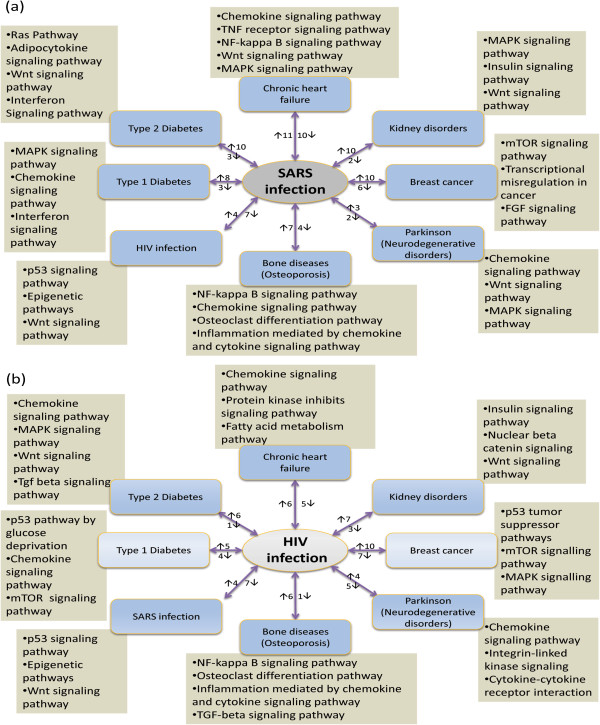
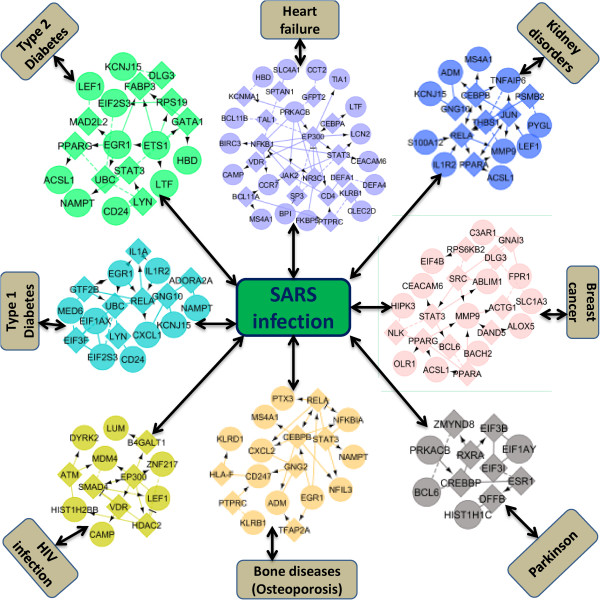
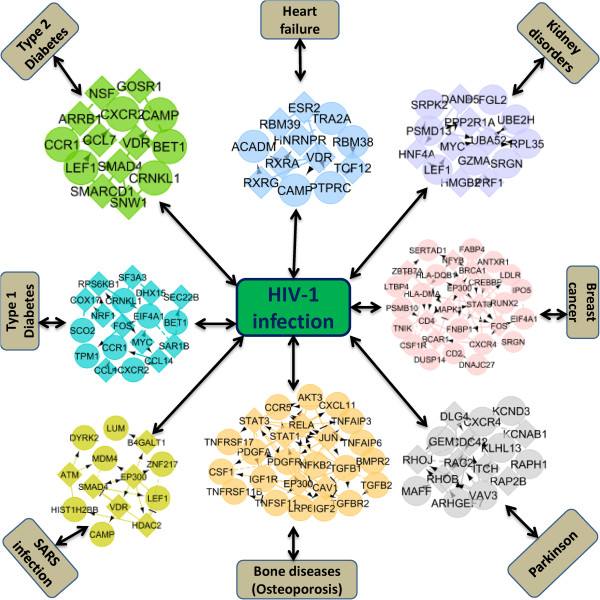
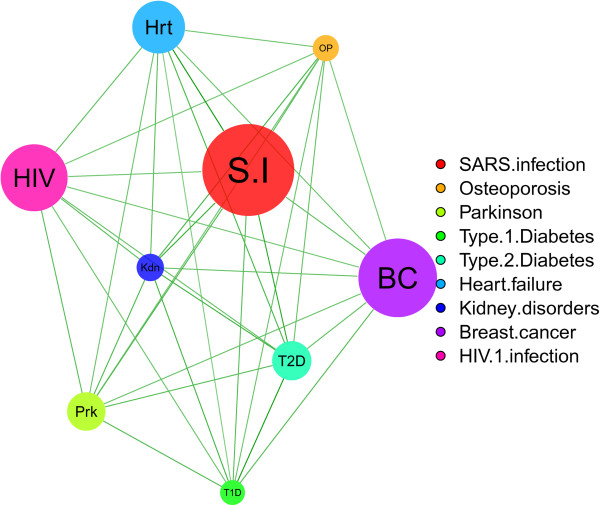
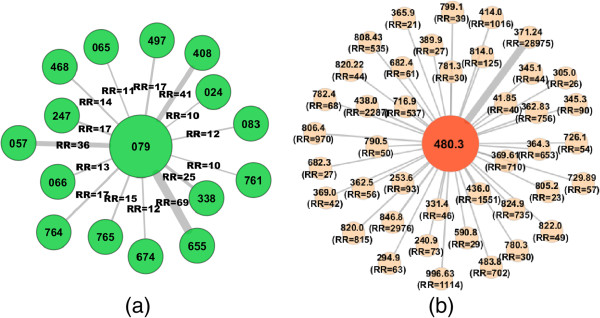
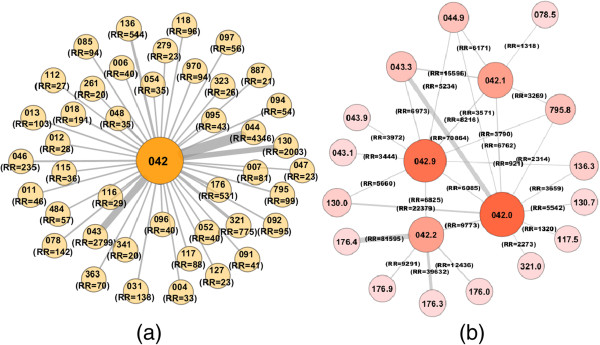
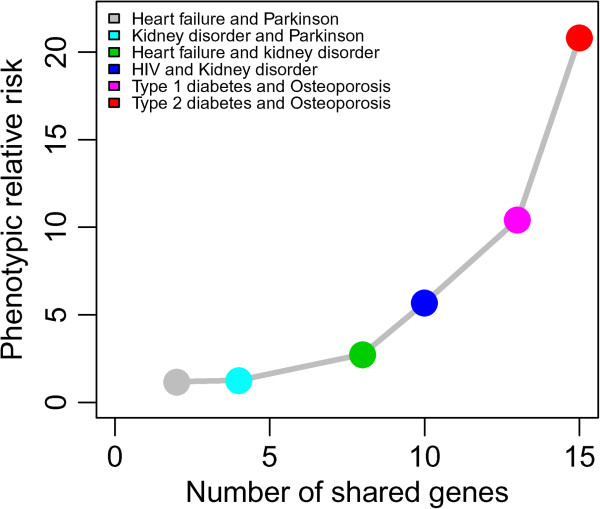
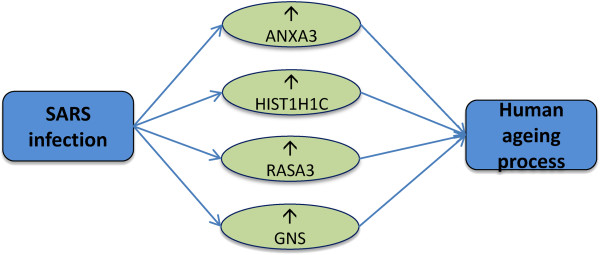
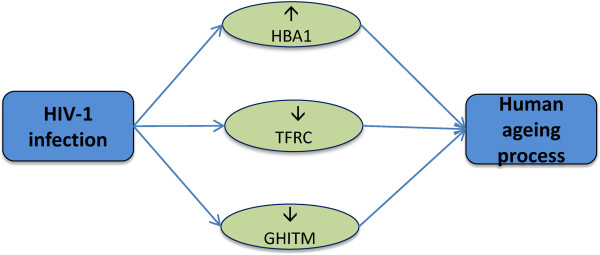
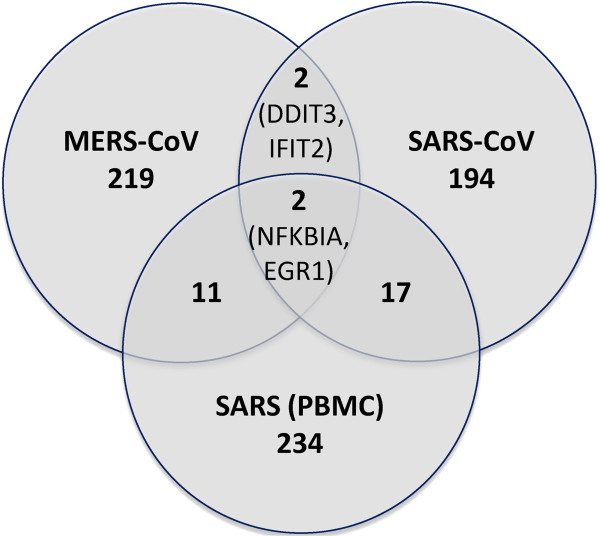
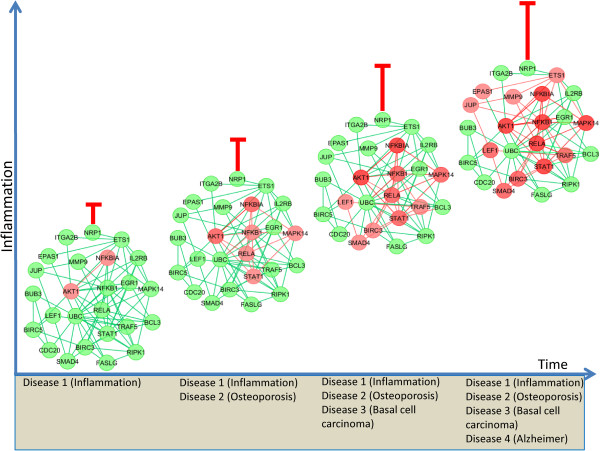
Results: We present a quantitative framework to compare and explore comorbidity between diseases. By using neighbourhood based benchmark and topological methods, we have built comorbidity relationships network based on the OMIM and our identified significant genes. Then based on the gene expression, PPI and signalling pathways data, we investigate the comorbidity association of these 2 infective pathologies with other 7 diseases (heart failure, kidney disorder, breast cancer, neurodegenerative disorders, bone diseases, Type 1 and Type 2 diabetes). Phenotypic association is measured by calculating both the Relative Risk as the quantified measures of comorbidity tendency of two disease pairs and the ϕ-correlation to measure the robustness of the comorbidity associations. The differential gene expression profiling strongly suggests that the response of SARS affected patients seems to be mainly an innate inflammatory response and statistically dysregulates a large number of genes, pathways and PPIs subnetworks in different pathologies such as chronic heart failure (21 genes), breast cancer (16 genes) and bone diseases (11 genes). HIV-1 induces comorbidities relationship with many other diseases, particularly strong correlation with the neurological, cancer, metabolic and immunological diseases. Similar comorbidities risk is observed from the clinical information. Moreover, SARS and HIV infections dysregulate 4 genes (ANXA3, GNS, HIST1H1C, RASA3) and 3 genes (HBA1, TFRC, GHITM) respectively that affect the ageing process. It is notable that HIV and SARS similarly dysregulated 11 genes and 3 pathways. Only 4 significantly dysregulated genes are common between SARS-CoV and MERS-CoV, including NFKBIA that is a key regulator of immune responsiveness implicated in susceptibility to infectious and inflammatory diseases.
Conclusions: Our method presents a ripe opportunity to use data-driven approaches for advancing our current knowledge on disease mechanism and predicting disease comorbidities in a quantitative way.
Figures
Similar articles
-
Emerging coronaviruses: first SARS, second MERS and third SARS-CoV-2: epidemiological updates of COVID-19.Infez Med. 2020 Jun 1;28(suppl 1):6-17. Infez Med. 2020. PMID: 32532933 Review.
-
Dangerous liaisons? The role of inflammation and comorbidities in HIV and SARS-CoV-2 infection.Expert Rev Clin Immunol. 2021 Mar;17(3):201-208. doi: 10.1080/1744666X.2021.1886080. Epub 2021 Feb 12. Expert Rev Clin Immunol. 2021. PMID: 33538189 Review.
-
A Comparison of the Clinical, Viral, Pathologic, and Immunologic Features of Severe Acute Respiratory Syndrome (SARS), Middle East Respiratory Syndrome (MERS), and Coronavirus 2019 (COVID-19) Diseases.Arch Pathol Lab Med. 2021 Oct 1;145(10):1194-1211. doi: 10.5858/arpa.2020-0820-SA. Arch Pathol Lab Med. 2021. PMID: 34232978 Review.
-
Analysis of type I IFN response and T cell activation in severe COVID-19/HIV-1 coinfection: A case report.Medicine (Baltimore). 2020 Sep 4;99(36):e21803. doi: 10.1097/MD.0000000000021803. Medicine (Baltimore). 2020. PMID: 32899009 Free PMC article.
-
Binding affinities of 438 HLA proteins to complete proteomes of seven pandemic viruses and distributions of strongest and weakest HLA peptide binders in populations worldwide.HLA. 2020 Sep;96(3):277-298. doi: 10.1111/tan.13956. Epub 2020 Jun 11. HLA. 2020. PMID: 32475052 Free PMC article.
Cited by
-
Association of Pre-Existing Comorbidities with Disease Severity Among COVID-19 Patients in Eastern Ethiopia.Infect Drug Resist. 2022 Jun 1;15:2825-2834. doi: 10.2147/IDR.S362140. eCollection 2022. Infect Drug Resist. 2022. PMID: 35673546 Free PMC article.
-
Multiplex methods provide effective integration of multi-omic data in genome-scale models.BMC Bioinformatics. 2016 Mar 2;17 Suppl 4(Suppl 4):83. doi: 10.1186/s12859-016-0912-1. BMC Bioinformatics. 2016. PMID: 26961692 Free PMC article.
-
Clinical features, comorbidities, complications and treatment options in severe and non-severe COVID-19 patients: A systemic review and meta-analysis.Nurs Open. 2021 May;8(3):1077-1088. doi: 10.1002/nop2.718. Epub 2020 Nov 27. Nurs Open. 2021. PMID: 34482663 Free PMC article.
-
Frequency of Comorbidities in Admitting COVID-19 Pneumonia Patients in a Tertiary Care Setup: An Observational Study.Cureus. 2021 Feb 25;13(2):e13546. doi: 10.7759/cureus.13546. Cureus. 2021. PMID: 33815969 Free PMC article.
-
Diabetes and metabolic syndrome as risk factors for COVID-19.Diabetes Metab Syndr. 2020 Jul-Aug;14(4):671-677. doi: 10.1016/j.dsx.2020.05.013. Epub 2020 May 8. Diabetes Metab Syndr. 2020. PMID: 32438331 Free PMC article.
References
-
- Tong B, Stevenson C. Comorbidity of Cardiovascular Disease, Diabetes and Chronic Kidney Disease in Australia. Canberra: Australian Institute of Health and Welfare; 2007.
Publication types
MeSH terms
LinkOut - more resources
Full Text Sources
Other Literature Sources
Medical
Miscellaneous
