. 2015 Jan;81(1):320-31.
doi: 10.1128/AEM.02484-14. Epub 2014 Oct 24.

Molecular and metabolic adaptations of Lactococcus lactis at near-zero growth rates

Affiliations

Molecular and metabolic adaptations of Lactococcus lactis at near-zero growth rates

Onur Ercan et al. Appl Environ Microbiol. 2015 Jan.

Abstract

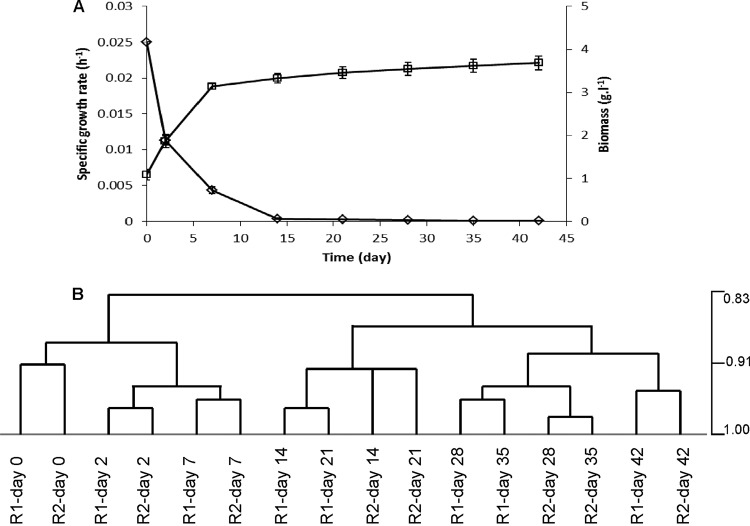
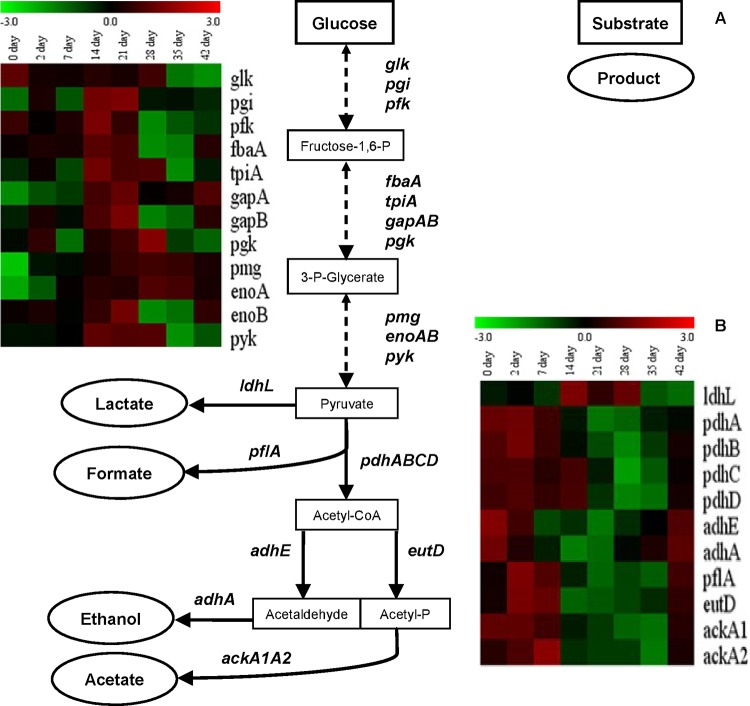
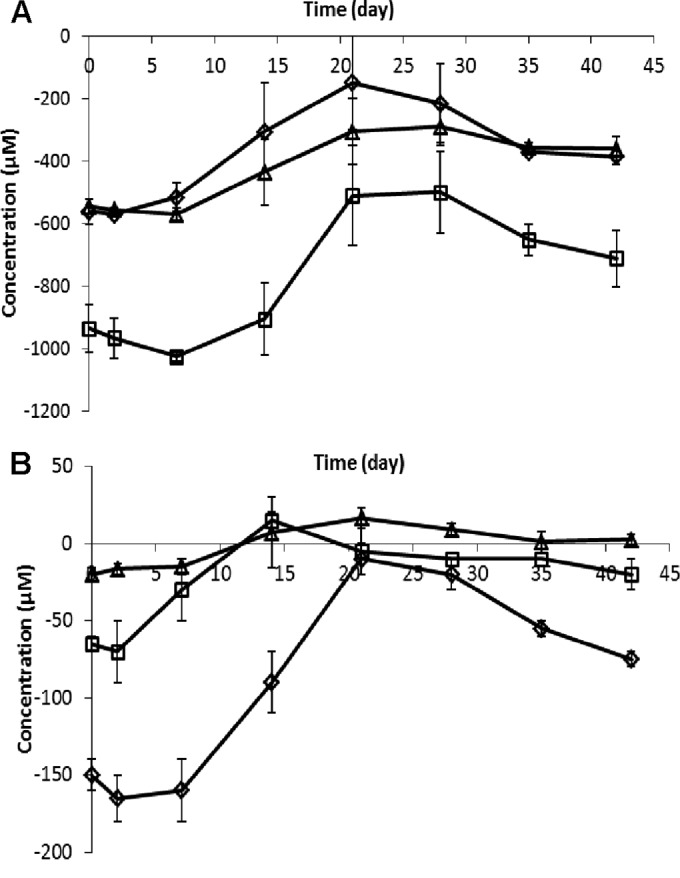
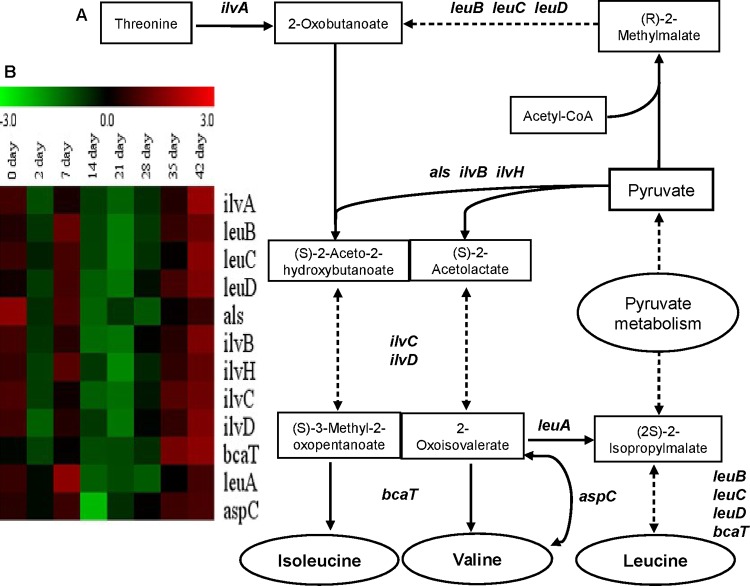
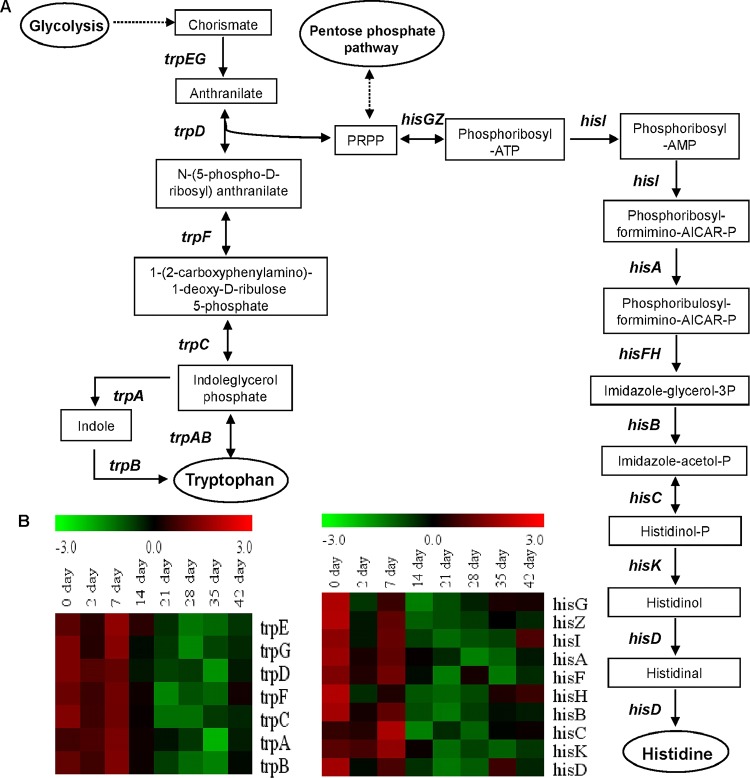
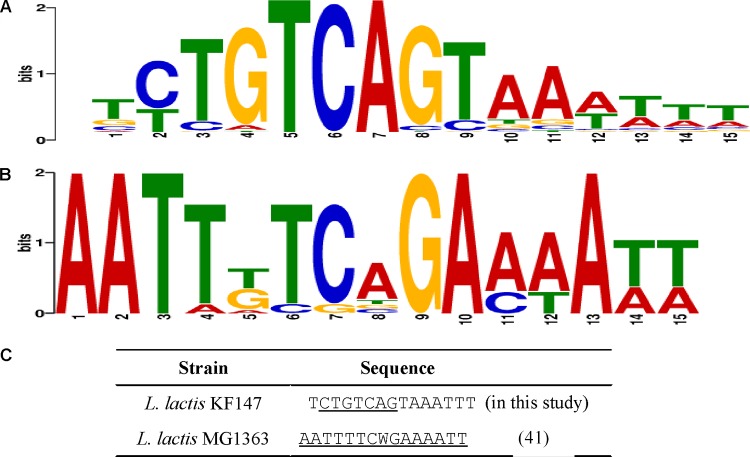
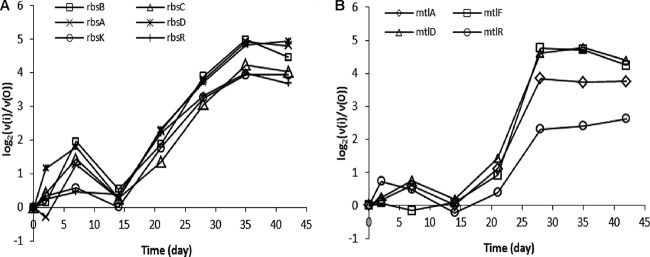
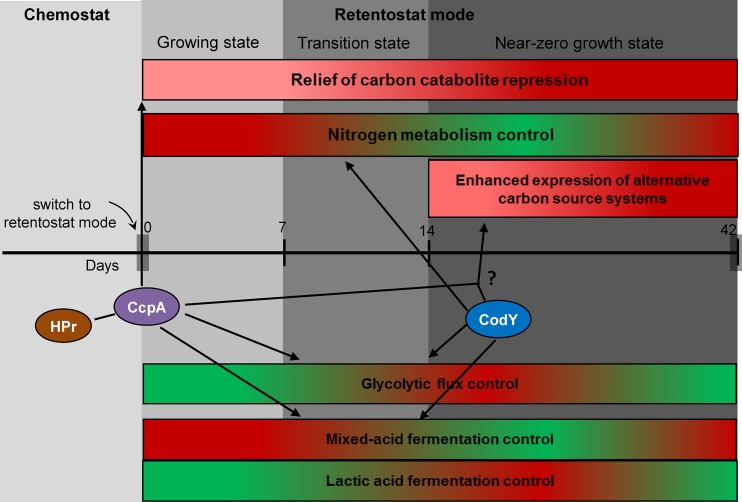
This paper describes the molecular and metabolic adaptations of Lactococcus lactis during the transition from a growing to a near-zero growth state by using carbon-limited retentostat cultivation. Transcriptomic analyses revealed that metabolic patterns shifted between lactic- and mixed-acid fermentations during retentostat cultivation, which appeared to be controlled at the level of transcription of the corresponding pyruvate dissipation-encoding genes. During retentostat cultivation, cells continued to consume several amino acids but also produced specific amino acids, which may derive from the conversion of glycolytic intermediates. We identify a novel motif containing CTGTCAG in the upstream regions of several genes related to amino acid conversion, which we propose to be the target site for CodY in L. lactis KF147. Finally, under extremely low carbon availability, carbon catabolite repression was progressively relieved and alternative catabolic functions were found to be highly expressed, which was confirmed by enhanced initial acidification rates on various sugars in cells obtained from near-zero-growth cultures. The present integrated transcriptome and metabolite (amino acids and previously reported fermentation end products) study provides molecular understanding of the adaptation of L. lactis to conditions supporting low growth rates and expands our earlier analysis of the quantitative physiology of this bacterium at near-zero growth rates toward gene regulation patterns involved in zero-growth adaptation.


Figures

FIG 1
FIG 1
Growth of L. lactis KF147 and hierarchical clustering linkage of transcriptome profiles in retentostat culture. A steady-state anaerobic chemostat culture was switched to retentostat mode at time zero. (A) Data points represent average values ± standard deviations of measurements of two independent cultures. Shown are the specific growth rate (h−1) (diamonds) and biomass accumulation (g liter−1) (squares) of L. lactis KF147 under retentostat conditions (adapted from reference 10). (B) Hierarchical clustering linkage of retentostat 1 (R1) and 2 (R2) samples. Complete clustering linkage was performed for samples obtained on days 0, 2, 7, 14, 21, 28, 35, and 42 of duplicate retentostat cultivations based on Pearson correlation analysis using MeV.
FIG 2
FIG 2
Overview of CCM in L. lactis KF147. (A) Simple scheme of glycolysis and pyruvate dissipation pathways. Each one-headed arrow represents one metabolic reaction, and each two-headed dashed arrow corresponds to more than one reaction. Genes are indicated beside the arrows. End products are indicated in ellipses. (B) Heat map of L. lactis KF147 glycolysis and pyruvate dissipation genes differentially expressed (on a log2 scale, P ≤ 0.05) during retentostat cultivation over the beginning of chemostat cultivation (day 0) (retentostat 1). Similar transcriptome results obtained in retentostat 2 confirmed the consistency of these results in an independent experiment.
FIG 3
FIG 3
Concentration of BCAAs (A) and AAAs (B) in L. lactis KF147 in retentostat culture. Data points represent average values ± standard deviations of measurements of two independent cultures. (A) Concentrations of Val (diamonds), Leu (squares), and Ile (triangles). (B) Concentrations of Phe (diamonds), Tyr (squares), and Trp (triangles). Each concentration in panels A and B is presented as the difference between the measured concentration in the medium feed and the measured concentration in the filter line efflux sample. Negative values indicate net consumption; positive values indicate net production.
FIG 4
FIG 4
Overview of BCAA biosynthesis in L. lactis KF147. (A) Simple scheme of Ile, Val, and Leu amino acid production pathways. Each one-headed arrow represents one metabolic reaction, and each two-headed dashed arrow corresponds to more than one reaction. Genes are indicated beside the arrows. End products are indicated in ellipses. (B) Heat map of L. lactis KF147 BCAA biosynthesis genes differentially expressed (on a log2 scale, P ≤ 0.05) during retentostat cultivation over the beginning of chemostat cultivation (day 0) (retentostat 1). Similar transcriptome results obtained in retentostat 2 confirmed the consistency of these results in an independent experiment.
FIG 5
FIG 5
Overview of Trp (AAA) and His biosynthesis in L. lactis KF147. (A) Simple scheme of Trp and His amino acid production pathways. One arrow represents one metabolic reaction, and dashed-line arrows correspond to more than one reaction. Genes are indicated beside the arrows. End products are indicated in ellipses. (B) Heat map of L. lactis KF147 BCAA Trp and His biosynthesis genes differentially expressed (on a log2 scale, P ≤ 0.05) during retentostat cultivation over the beginning of chemostat cultivation (day 0) (retentostat 1). Similar transcriptome results obtained in retentostat 2 confirmed the consistency of these results in an independent experiment.
FIG 6
FIG 6
WebLogo visualization of the postulated CodY motif in L. lactis KF147 (A) and the experimentally identified CodY motif in L. lactis MG1363 (41) (B) and alignment of the CodY motifs of both strains. (A) The postulated CodY binding sequence found in L. lactis KF147. The CTGTCAG palindrome sequence that forms the core of the motif is positioned at nucleotides 2 to 8. The thymidine at position 5 appears to be conserved as well. (B) The experimentally verified CodY motif in L. lactis MG1363. (C) The consensus CodY motifs identified in L. lactis MG1363 and L. lactis KF147, in which the proposed motif sequence is underlined.
FIG 7
FIG 7
Graphs of the expression of genes involved in ribose (A) and mannitol (B) uptake and metabolism during retentostat cultivation over the beginning of chemostat cultivation (day 0) from model profiles 40 and 41 (retentostat 1). Similar transcriptome results obtained in retentostat 2 confirmed the consistency of these results in an independent experiment.
FIG 8
FIG 8
Integrated view of adaptive regulation of L. lactis KF147 to near-zero growth rates induced by retentostat cultivation. In rectangular boxes, red and green indicate increased and decreased expression of the functional categories shown, respectively.

Similar articles

Cited by

References

    1. Hoehler TM, Jorgensen BB. 2013. Microbial life under extreme energy limitation. Nat Rev Microbiol 11:83–94. doi:10.1038/nrmicro2939. - DOI - PubMed
    1. Boender LGM, de Hulster EAF, van Maris AJA, Daran-Lapujade P, Pronk JT. 2009. Quantitative physiology of Saccharomyces cerevisiae at near-zero specific growth rates. Appl Environ Microbiol 75:5607–5614. doi:10.1128/AEM.00429-09. - DOI - PMC - PubMed
    1. Koch AL. 1971. The adaptive responses of Escherichia coli to a famine and feast existence. Adv Microb Physiol 6:147–217. doi:10.1016/S0065-2911(08)60069-7. - DOI - PubMed
    1. Hugas M, Monfort JM. 1997. Bacterial starter cultures for meat fermentation. Food Chem 59:547–554. doi:10.1016/S0308-8146(97)00005-8. - DOI
    1. Smit G, Smit BA, Engels WJ M. 2005. Flavour formation by lactic acid bacteria and biochemical flavor profiling of cheese products. FEMS Microbiol Rev 29:591–610. doi:10.1016/j.fmrre.2005.04.002. - DOI - PubMed

MeSH terms

Associated data