

Dynamic evolution of the GnRH receptor gene family in vertebrates
- PMID: 25344287
- PMCID: PMC4232701
- DOI: 10.1186/s12862-014-0215-y
Dynamic evolution of the GnRH receptor gene family in vertebrates
Abstract
Background: Elucidating the mechanisms underlying coevolution of ligands and receptors is an important challenge in molecular evolutionary biology. Peptide hormones and their receptors are excellent models for such efforts, given the relative ease of examining evolutionary changes in genes encoding for both molecules. Most vertebrates possess multiple genes for both the decapeptide gonadotropin releasing hormone (GnRH) and for the GnRH receptor. The evolutionary history of the receptor family, including ancestral copy number and timing of duplications and deletions, has been the subject of controversy.
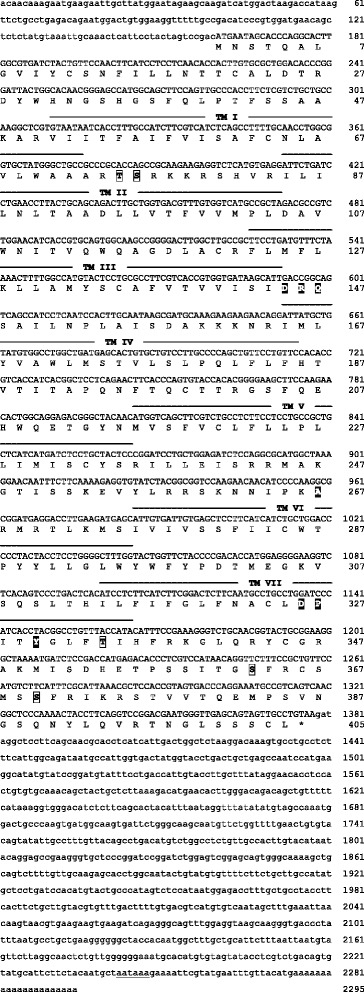
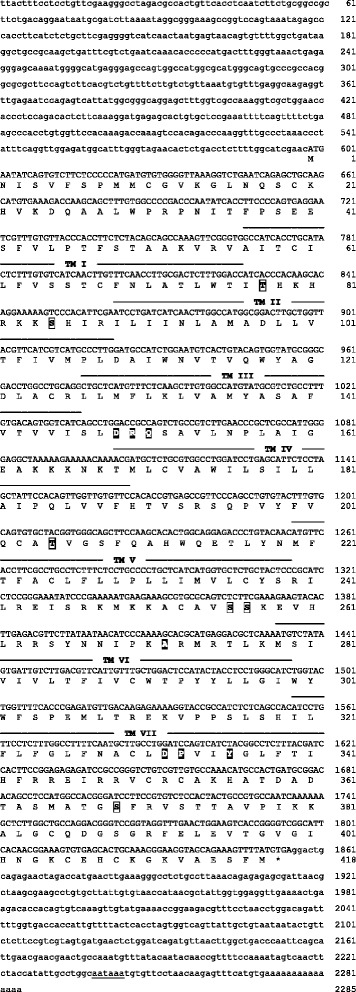
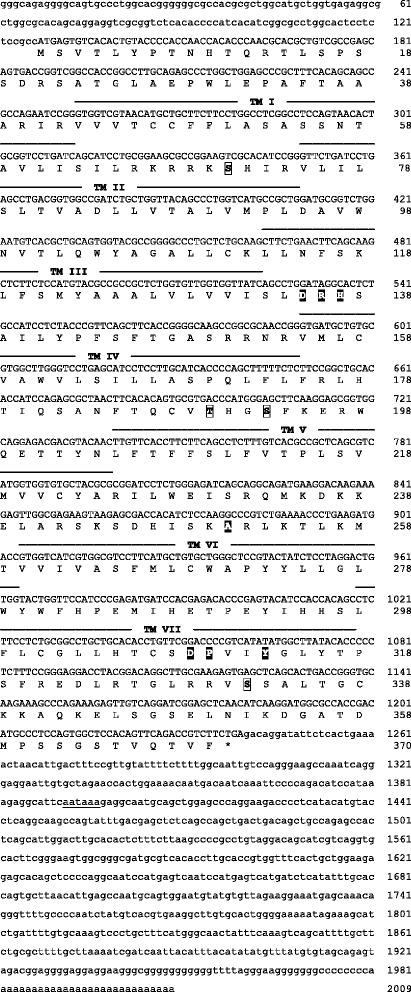
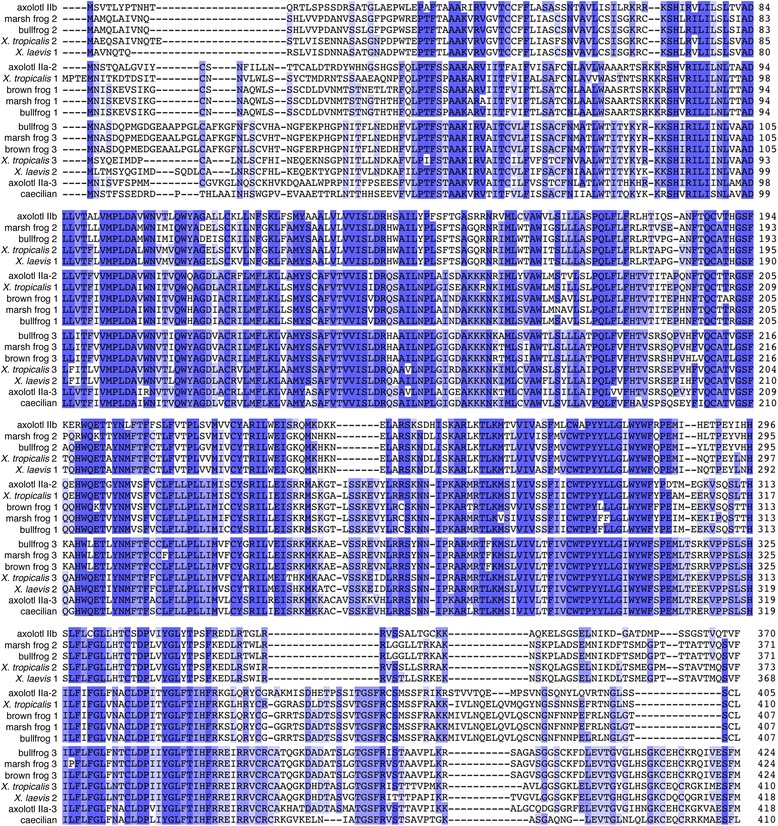
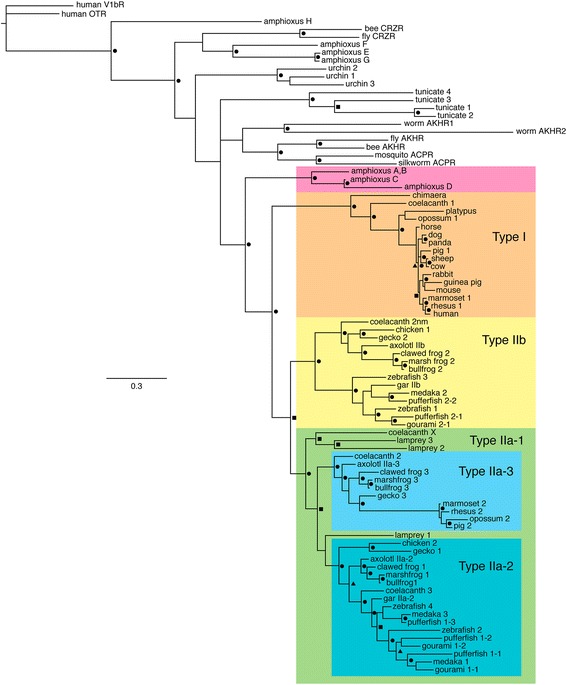
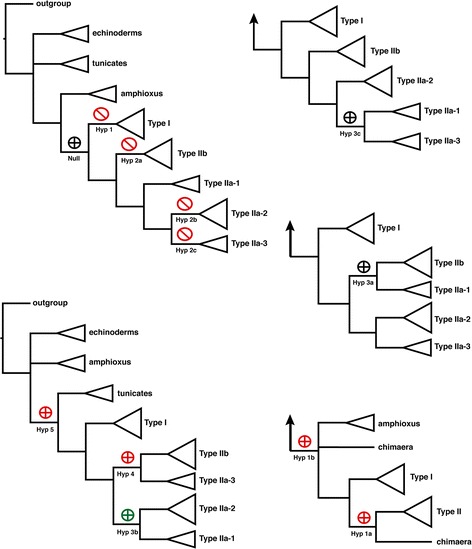
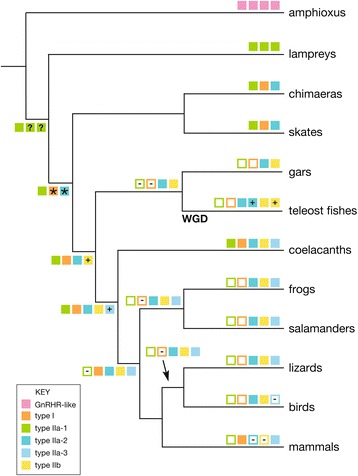
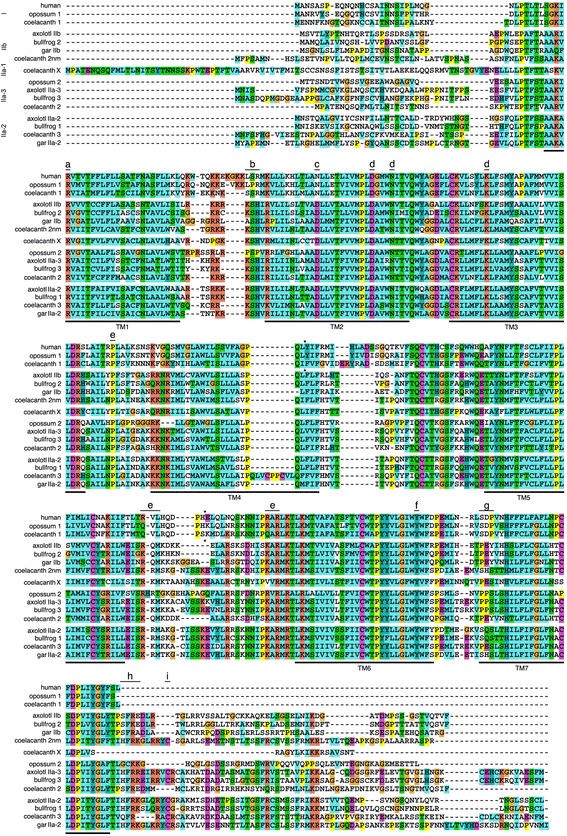
Results: We report here for the first time sequences of three distinct GnRH receptor genes in salamanders (axolotls, Ambystoma mexicanum), which are orthologous to three GnRH receptors from ranid frogs. To understand the origin of these genes within the larger evolutionary context of the gene family, we performed phylogenetic analyses and probabilistic protein homology searches of GnRH receptor genes in vertebrates and their near relatives. Our analyses revealed four points that alter previous views about the evolution of the GnRH receptor gene family. First, the "mammalian" pituitary type GnRH receptor, which is the sole GnRH receptor in humans and previously presumed to be highly derived because it lacks the cytoplasmic C-terminal domain typical of most G-protein coupled receptors, is actually an ancient gene that originated in the common ancestor of jawed vertebrates (Gnathostomata). Second, unlike previous studies, we classify vertebrate GnRH receptors into five subfamilies. Third, the order of subfamily origins is the inverse of previous proposed models. Fourth, the number of GnRH receptor genes has been dynamic in vertebrates and their ancestors, with multiple duplications and losses.
Conclusion: Our results provide a novel evolutionary framework for generating hypotheses concerning the functional importance of structural characteristics of vertebrate GnRH receptors. We show that five subfamilies of vertebrate GnRH receptors evolved early in the vertebrate phylogeny, followed by several independent instances of gene loss. Chief among cases of gene loss are humans, best described as degenerate with respect to GnRH receptors because we retain only a single, ancient gene.
Figures
Similar articles
-
GnRH receptors and peptides: skating backward.Gen Comp Endocrinol. 2014 Dec 1;209:118-34. doi: 10.1016/j.ygcen.2014.07.025. Epub 2014 Aug 5. Gen Comp Endocrinol. 2014. PMID: 25107740 Review.
-
Cloning and expression, pharmacological characterization, and internalization kinetics of the pituitary GnRH receptor in a metatherian species of mammal.Gen Comp Endocrinol. 2000 Mar;117(3):439-48. doi: 10.1006/gcen.1999.7418. Gen Comp Endocrinol. 2000. PMID: 10764554
-
Evolution of the AKH/corazonin/ACP/GnRH receptor superfamily and their ligands in the Protostomia.Gen Comp Endocrinol. 2014 Dec 1;209:35-49. doi: 10.1016/j.ygcen.2014.07.009. Epub 2014 Jul 21. Gen Comp Endocrinol. 2014. PMID: 25058364 Review.
-
Cloning and characterization of a functional type II gonadotropin-releasing hormone receptor with a lengthy carboxy-terminal tail from an ancestral vertebrate, the sea lamprey.Endocrinology. 2005 Aug;146(8):3351-61. doi: 10.1210/en.2005-0305. Epub 2005 May 5. Endocrinology. 2005. PMID: 15878963
-
Evolution of GnRH: diving deeper.Gen Comp Endocrinol. 2011 Mar 1;171(1):1-16. doi: 10.1016/j.ygcen.2010.12.014. Epub 2010 Dec 23. Gen Comp Endocrinol. 2011. PMID: 21185290 Review.
Cited by
-
Differential involvement of cAMP/PKA-, PLC/PKC- and Ca2+/calmodulin-dependent pathways in GnRH-induced prolactin secretion and gene expression in grass carp pituitary cells.Front Endocrinol (Lausanne). 2024 Jun 4;15:1399274. doi: 10.3389/fendo.2024.1399274. eCollection 2024. Front Endocrinol (Lausanne). 2024. PMID: 38894746 Free PMC article.
-
Addition of a carboxy-terminal tail to the normally tailless gonadotropin-releasing hormone receptor impairs fertility in female mice.Elife. 2021 Dec 23;10:e72937. doi: 10.7554/eLife.72937. Elife. 2021. PMID: 34939930 Free PMC article.
-
Morphological Evidence for Functional Crosstalk Between Multiple GnRH Systems in the Male Tilapia, Oreochromis niloticus.Front Endocrinol (Lausanne). 2020 Sep 2;11:586. doi: 10.3389/fendo.2020.00586. eCollection 2020. Front Endocrinol (Lausanne). 2020. PMID: 32982977 Free PMC article.
-
Gonadotropin-Releasing Hormone (GnRH) Receptor Structure and GnRH Binding.Front Endocrinol (Lausanne). 2017 Oct 24;8:274. doi: 10.3389/fendo.2017.00274. eCollection 2017. Front Endocrinol (Lausanne). 2017. PMID: 29123501 Free PMC article. Review.
-
A Type IIb, but Not Type IIa, GnRH Receptor Mediates GnRH-Induced Release of Growth Hormone in the Ricefield Eel.Front Endocrinol (Lausanne). 2018 Nov 30;9:721. doi: 10.3389/fendo.2018.00721. eCollection 2018. Front Endocrinol (Lausanne). 2018. PMID: 30555419 Free PMC article.
References
-
- De Roux N, Young J, Misrahi M, Schaison G, Milgrom E. Loss of function mutations of the GnRH receptor: A new cause of hypogonadotropic hypogonadism. J Ped Endocrinol Metabol. 1999;12:267–275. - PubMed
-
- Wu S, Wilson MD, Busby ER, Isaac ER, Sherwood NM. Disruption of the single copy gonadotropin-releasing hormone receptor in mice by gene trap: severe reduction of reproductive organs and functions in developing and adult mice. Endocrinology. 2010;151:1142–1152. doi: 10.1210/en.2009-0598. - DOI - PubMed
-
- Reinhart J, Mertz LM, Catt KJ. Molecular cloning and expression of cDNA encoding the murine gonadotropin-releasing hormone receptor. J Biol Chem. 1992;267:21281–21284. - PubMed
Publication types
MeSH terms
Substances
Grants and funding
LinkOut - more resources
Full Text Sources
Other Literature Sources
Molecular Biology Databases
