. 2015 Apr;290(2):559-71.
doi: 10.1007/s00438-014-0932-3. Epub 2014 Oct 25.

Genotyping-by-sequencing based intra-specific genetic map refines a ''QTL-hotspot" region for drought tolerance in chickpea

Affiliations

Genotyping-by-sequencing based intra-specific genetic map refines a ''QTL-hotspot" region for drought tolerance in chickpea

Deepa Jaganathan et al. Mol Genet Genomics. 2015 Apr.

Abstract

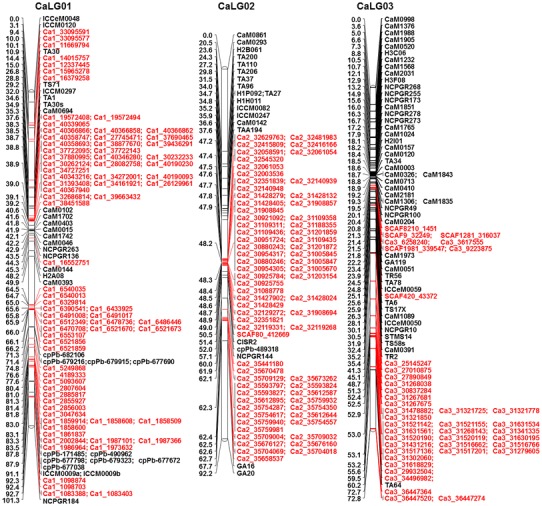
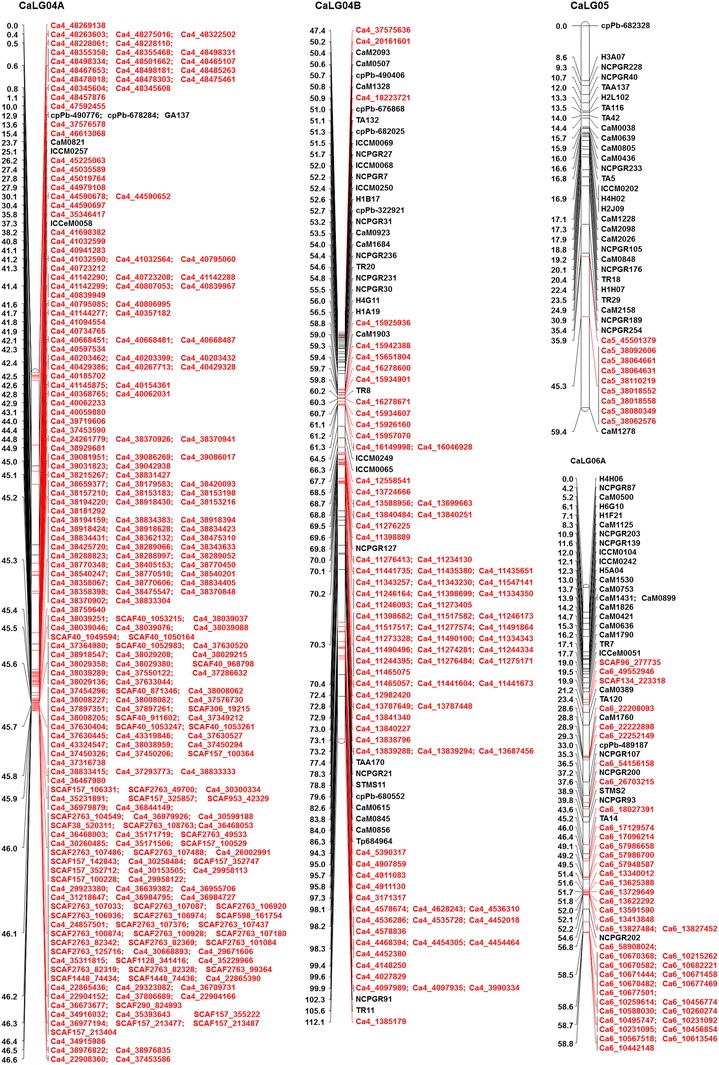
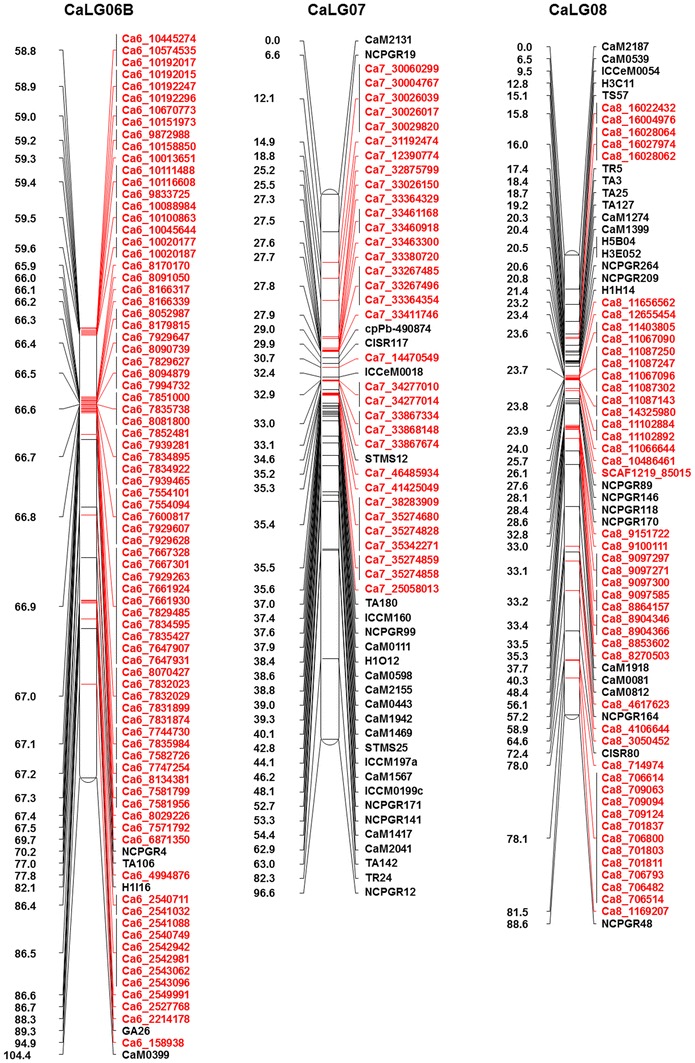
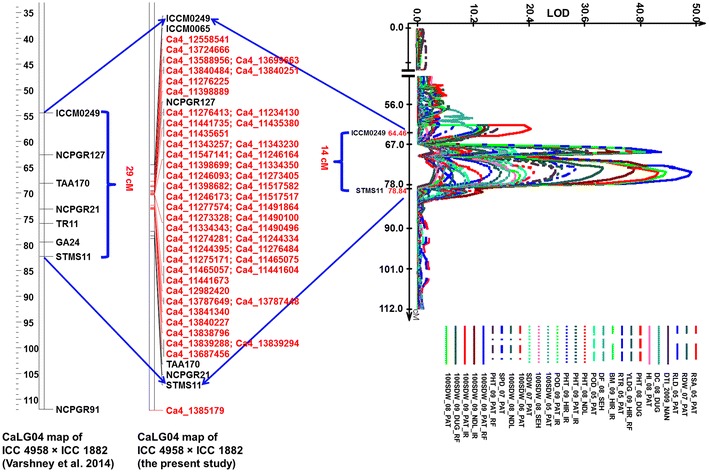
To enhance the marker density in the "QTL-hotspot" region, harboring several QTLs for drought tolerance-related traits identified on linkage group 04 (CaLG04) in chickpea recombinant inbred line (RIL) mapping population ICC 4958 × ICC 1882, a genotyping-by-sequencing approach was adopted. In total, 6.24 Gb data from ICC 4958, 5.65 Gb data from ICC 1882 and 59.03 Gb data from RILs were generated, which identified 828 novel single-nucleotide polymorphisms (SNPs) for genetic mapping. Together with these new markers, a high-density intra-specific genetic map was developed that comprised 1,007 marker loci spanning a distance of 727.29 cM. QTL analysis using the extended genetic map along with precise phenotyping data for 20 traits collected over one to seven seasons identified 49 SNP markers in the "QTL-hotspot" region. These efforts have refined the "QTL-hotspot" region to 14 cM. In total, 164 main-effect QTLs including 24 novel QTLs were identified. In addition, 49 SNPs integrated in the "QTL-hotspot" region were converted into cleaved amplified polymorphic sequence (CAPS) and derived CAPS (dCAPS) markers which can be used in marker-assisted breeding.


Figures

Fig. 1
Fig. 1
High-density intra-specific genetic map of chickpea (ICC 4958 × ICC 1882). This map is comprised of 1,007 markers including 743 novel SNPs from GBS approach and spans 727.29 cM. Genetic distances (cM) were shown on the left side and the markers were shown on the right side of the bars. Map was constructed using JoinMap 4.0 and Kosambi function. Markers in black color font are from the framework map and markers in red color font are newly generated SNP markers. For clear visualization, the CaLG04 and CaLG06 were split into two parts and named as A, B
Fig. 1
Fig. 1
High-density intra-specific genetic map of chickpea (ICC 4958 × ICC 1882). This map is comprised of 1,007 markers including 743 novel SNPs from GBS approach and spans 727.29 cM. Genetic distances (cM) were shown on the left side and the markers were shown on the right side of the bars. Map was constructed using JoinMap 4.0 and Kosambi function. Markers in black color font are from the framework map and markers in red color font are newly generated SNP markers. For clear visualization, the CaLG04 and CaLG06 were split into two parts and named as A, B
Fig. 2
Fig. 2
Saturated “QTL-hotspot” region with additional markers. The figure shows comparison of the “QTL-hotspot” updated with 49 novel SNP markers in this study and with the one reported by Varshney et al. (2014a)

Similar articles

Cited by

References

    1. Conesa A, Gotz S, Garcia-Gomez JM, Terol J, Talon M, Robles M. Blast2GO: a universal tool for annotation, visualization and analysis in functional genomics research. Bioinformatics. 2005;21:3674–3676. doi: 10.1093/bioinformatics/bti610. - DOI - PubMed
    1. Cuc LM, Mace ES, Crouch JH, Quang VD, Long TD, Varshney RK. Isolation and characterization of novel microsatellite markers and their application for diversity assessment in cultivated groundnut (Arachis hypogaea) BMC Plant Biol. 2008;8:55. doi: 10.1186/1471-2229-8-55. - DOI - PMC - PubMed
    1. Deschamps S, Nannapaneni K, Zhang Y, Hayes K. Local assemblies of paired end reduced representation libraries sequenced with the Illumina genome analyser in Maize. Int J Plant Genomics. 2012;2012:8. doi: 10.1155/2012/360598. - DOI - PMC - PubMed
    1. Dodig D, Zorić M, Kandić V, Perović D, Šurlan-Momirović G. Comparison of responses to drought stress of 100 wheat accessions and landraces to identify opportunities for improving wheat drought resistance. Plant Breed. 2012;131:369–379. doi: 10.1111/j.1439-0523.2011.01941.x. - DOI
    1. Elshire RJ, Glaubitz JC, Sun Q, Poland JA, Kawamoto K, Buckler ES, Mitchell SE. A robust, simple genotyping-by-sequencing (GBS) approach for high diversity species. PLoS One. 2011;6(5):e19379. doi: 10.1371/journal.pone.0019379. - DOI - PMC - PubMed

Publication types

Substances

LinkOut - more resources