

The predictive effect of body mass index on type 2 diabetes in the Norwegian women and cancer study
- PMID: 25344292
- PMCID: PMC4223755
- DOI: 10.1186/1476-511X-13-164
The predictive effect of body mass index on type 2 diabetes in the Norwegian women and cancer study
Abstract
Background: Several studies have analyzed the association of body mass index (BMI) with either the prevalence or incidence of type 2 diabetes (T2D), but no study from Europe or North America has yet analyzed and compared the association of BMI with both incident and prevalent T2D cases.
Methods: Stratified logistic regression was used to calculate odds ratios (OR), and stratified Cox proportional hazards regression was used to calculate hazard ratios (HR) of the effect of BMI on the prevalence, and incidence of T2D. Wald chi-square statistics were applied when comparing the risk estimates.
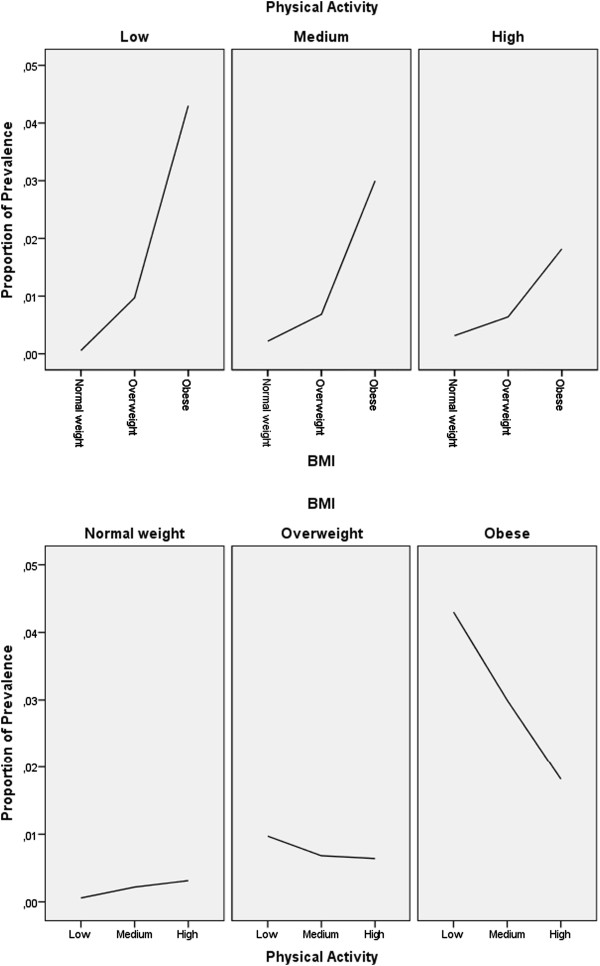
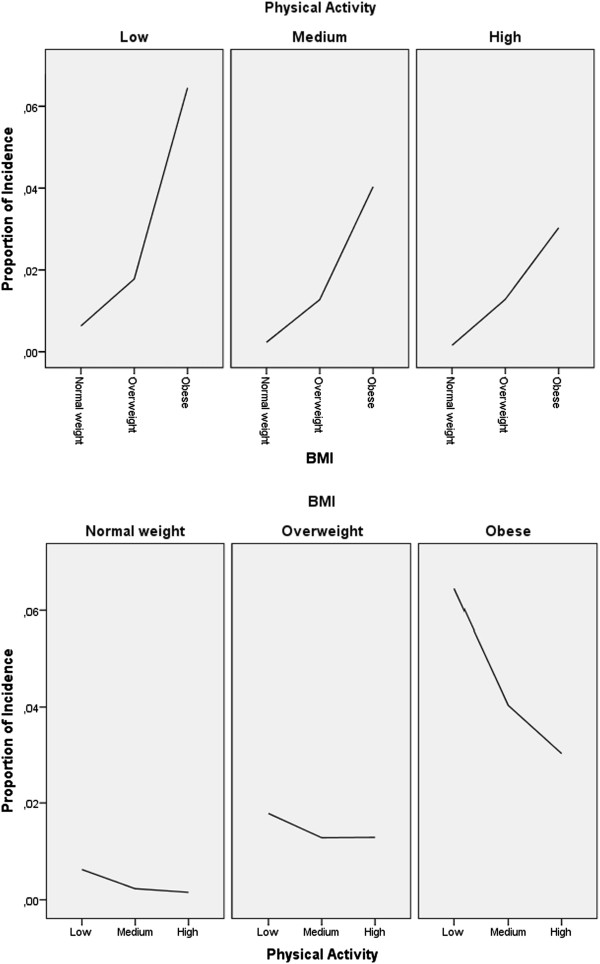
Results: Among prevalent T2D cases, overweight women (BMI 25-29.9 kg/m2) had an OR of 2.83 (95% confidence interval [CI], 1.92-4.18) and obese women (BMI ≥30 kg/m2) had an OR of 12.12 (95% CI, 8.32-17.68) when compared with normal weight women (BMI <25 kg/m2). Among incident T2D cases, overweight women had a HR of 5.01 (95% CI, 3.59-6.98) and obese women had a HR of 15.99 (95% CI, 11.39-22.46) when compared with normal weight women. After stratification by level of physical activity, and adjustment for age, smoking status, and education level, the Wald chi-square statistic for BMI was 180.90 for prevalent T2D cases, and 262.03 for incident T2D cases.
Conclusion: The predictive effect of BMI was found to be stronger for T2D incidence than T2D prevalence.
Figures
Similar articles
-
Long-term risk of incident type 2 diabetes and measures of overall and regional obesity: the EPIC-InterAct case-cohort study.PLoS Med. 2012;9(6):e1001230. doi: 10.1371/journal.pmed.1001230. Epub 2012 Jun 5. PLoS Med. 2012. PMID: 22679397 Free PMC article.
-
[Body mass index and cancer incidence:a prospective cohort study in northern China].Zhonghua Liu Xing Bing Xue Za Zhi. 2014 Mar;35(3):231-6. Zhonghua Liu Xing Bing Xue Za Zhi. 2014. PMID: 24831616 Chinese.
-
Type 2 diabetes and obesity in midlife and breast cancer risk in the Reykjavik cohort.Cancer Causes Control. 2019 Oct;30(10):1057-1065. doi: 10.1007/s10552-019-01213-y. Epub 2019 Aug 10. Cancer Causes Control. 2019. PMID: 31401707 Free PMC article.
-
Association of Obesity and Type 2 Diabetes with Non-Hodgkin Lymphoma: The Multiethnic Cohort.Cancer Epidemiol Biomarkers Prev. 2023 Oct 2;32(10):1348-1355. doi: 10.1158/1055-9965.EPI-23-0565. Cancer Epidemiol Biomarkers Prev. 2023. PMID: 37555836 Free PMC article.
-
Independent and combined effects of physical activity and body mass index on the development of Type 2 Diabetes - a meta-analysis of 9 prospective cohort studies.Int J Behav Nutr Phys Act. 2015 Dec 1;12:147. doi: 10.1186/s12966-015-0304-3. Int J Behav Nutr Phys Act. 2015. PMID: 26619831 Free PMC article.
Cited by
-
Systolic Blood Pressure and Risk of Type 2 Diabetes: A Mendelian Randomization Study.Diabetes. 2017 Feb;66(2):543-550. doi: 10.2337/db16-0868. Epub 2016 Oct 4. Diabetes. 2017. PMID: 27702834 Free PMC article.
-
Association of weight status and the risks of diabetes in adults: a systematic review and meta-analysis of prospective cohort studies.Int J Obes (Lond). 2022 Jun;46(6):1101-1113. doi: 10.1038/s41366-022-01096-1. Epub 2022 Feb 23. Int J Obes (Lond). 2022. PMID: 35197569
-
Association of mean arterial pressure with 5-year risk of incident diabetes in Chinese adults:a secondary population-based cohort study.BMJ Open. 2022 Sep 19;12(9):e048194. doi: 10.1136/bmjopen-2020-048194. BMJ Open. 2022. PMID: 36123108 Free PMC article.
-
Incidence and temporal trends in type 2 diabetes by weight status: A systematic review and meta-analysis of prospective cohort studies.J Glob Health. 2023 Sep 1;13:04088. doi: 10.7189/jogh.13.04088. J Glob Health. 2023. PMID: 37651631 Free PMC article.
-
Test-retest reliability of self-reported diabetes diagnosis in the Norwegian Women and Cancer Study: A population-based longitudinal study (n =33,919).SAGE Open Med. 2016 Jan 8;4:2050312115622857. doi: 10.1177/2050312115622857. eCollection 2016. SAGE Open Med. 2016. PMID: 26835013 Free PMC article.
References
-
- WHO: Diabetes epidemic in Europe. [http://www.euro.who.int/en/what-we-do/health-topics/noncommunicable-dise...]
-
- Jakab Z. Plenary Meeting of the European Parliament’s EU, Diabetes Working Group, held under the auspices of the Belgian Presidency of the EU; 8th December 2010. Brussels, Belgium: World Health Organization; 2010. Delivering for Diabetes in Europe.
MeSH terms
LinkOut - more resources
Full Text Sources
Other Literature Sources
Medical
