. 2014 Dec;20(12):1929-43.
doi: 10.1261/rna.047225.114. Epub 2014 Oct 24.

Generation of a neuro-specific microarray reveals novel differentially expressed noncoding RNAs in mouse models for neurodegenerative diseases

Affiliations

Generation of a neuro-specific microarray reveals novel differentially expressed noncoding RNAs in mouse models for neurodegenerative diseases

Ronald Gstir et al. RNA. 2014 Dec.

Abstract

We have generated a novel, neuro-specific ncRNA microarray, covering 1472 ncRNA species, to investigate their expression in different mouse models for central nervous system diseases. Thereby, we analyzed ncRNA expression in two mouse models with impaired calcium channel activity, implicated in Epilepsy or Parkinson's disease, respectively, as well as in a mouse model mimicking pathophysiological aspects of Alzheimer's disease. We identified well over a hundred differentially expressed ncRNAs, either from known classes of ncRNAs, such as miRNAs or snoRNAs or which represented entirely novel ncRNA species. Several differentially expressed ncRNAs in the calcium channel mouse models were assigned as miRNAs and target genes involved in calcium signaling, thus suggesting feedback regulation of miRNAs by calcium signaling. In the Alzheimer mouse model, we identified two snoRNAs, whose expression was deregulated prior to amyloid plaque formation. Interestingly, the presence of snoRNAs could be detected in cerebral spine fluid samples in humans, thus potentially serving as early diagnostic markers for Alzheimer's disease. In addition to known ncRNAs species, we also identified 63 differentially expressed, entirely novel ncRNA candidates, located in intronic or intergenic regions of the mouse genome, genomic locations, which previously have been shown to harbor the majority of functional ncRNAs.

Keywords: Alzheimer's disease; Parkinson's disease; microarray; noncoding RNAs; snoRNA; voltage-gated Ca2+ channels.


Figures

FIGURE 1.
FIGURE 1.
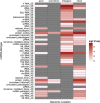
Biotype and genome location of ncRNAs from the neuro-ncRNA microarray. ncRNAs are sorted by ncRNA biotype and genomic locations. Frequencies are illustrated in log2 scale. Frequency of zero is indicated in gray. Strandness of ncRNAs is included in the biotype names (sense: “_SE,” antisense: “_AS”). Biotypes follow GENCODE/ENSEMBL annotation. Missing annotations are designated as “unknown.”
FIGURE 2.
FIGURE 2.
Differential expression analysis of ncRNAs between brain, liver, and muscle tissues, respectively. Volcano plots illustrate ncRNA levels of (A) liver and (B) muscle compared with brain tissue. ncRNAs with significant changes in expression are indicated by colored dots. Biotypes are designated by color code: miRNAs (red), snoRNAs (orange), tRNA (blue), other (green), and unknown biotype (gray). Vertical dashed lines indicate a twofold change in expression.
FIGURE 3.
FIGURE 3.
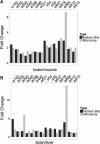
Comparison of expression analysis between Northern blot (black bars) and microarray analysis (gray bars) of 14 randomly chosen ncRNAs. (A) Expression changes of ncRNAs between brain and muscle tissues. (B) Expression changes of ncRNAs between brain and liver tissues. Candidate IDs are indicated on top. Details are listed in Supplemental Table 2. Fold changes from Northern blot analysis were quantified by using ImageQuant 8.1 (GE Healthcare).
FIGURE 4.
FIGURE 4.
Differential expression analysis of ncRNAs from selected brain regions of mouse models for voltage-gated calcium channel activity compared with wild type. (A) Cacnb4 mutant mouse: cerebellum. (B) CaV1.3−/−: hippocampus. (C) CaV1.3−/−: striatum. Box plots represent fold changes of ncRNAs (colored data points), which showed significant changes in expression relative to wild-type controls in microarray experiments. Fold changes are illustrated in log2 scale. Whiskers extend to ±1.5-fold of the interquartile range (IQR). Biotypes are designated by color code: miRNAs (red), snoRNA (orange), tRF (blue), other biotypes (green), and unknown biotype (gray). (D) Venn diagram illustrating the overlap of differentially expressed candidates between the models analyzed. (E) Fold change and annotation of ncRNA candidates highlighted in D.
FIGURE 5.
FIGURE 5.
Differential expression of ncRNAs from cortices of a triple-transgenic (3xTG) mouse model for Alzheimer's disease (Oddo et al. 2003) compared with wild-type controls at the age of 3, 10, and 20 mo, respectively. (A) Box plots represent fold changes of ncRNAs (colored data points), which showed significant changes in expression relative to their wild-type controls in microarray experiments. The experiments are illustrated from left to right: 3-, 10-, and 20-mo-old mice. Fold changes are illustrated in log2 scale. Whiskers extend to ±1.5-fold of the interquartile range (IQR). Biotypes are designated by color code: miRNAs (red), snoRNA (orange), tRF (blue), other biotypes (green), and unknown biotype (gray). (B) Venn diagram illustrating the overlap of differentially expressed candidates between the different age groups. (C) Fold change and annotation of ncRNA candidates highlighted in B.
FIGURE 6.
FIGURE 6.
Differentially expressed snoRNAs in young 3xTG AD mice. (A) Candidate e307: sequence similarity of mouse (mm9 assembly) to the human (hg19 assembly) snoRNA homologs (located on chromosome 5), and (left) predicted secondary structure illustrated by VARNA (http://varna.lri.fr/). (Right) Northern blot analysis of e307 from total RNA of cortices of 10-mo-old 3xTG mice compared with wild-type controls. (B) Candidate e470: genome positions of the two (red and green bars) potential loci of transcription (on chromosome 5), which differ by a single SNP (indicated in bold). Sequence similarity of HBII-336 and MBII-336; (left) predicted secondary structure illustrated by VARNA. (Right) Northern blot analysis from total RNA of cortices of 10-mo-old 3xTG mice compared with wild-type controls. C/D boxes are illustrated in red and sequences targeted by the oligonucleotide from the microarray e307 and e470, respectively, are highlighted in blue.

Similar articles

Cited by

References

    1. Alexandrov PN, Dua P, Hill JM, Bhattacharjee S, Zhao Y, Lukiw WJ 2012. microRNA (miRNA) speciation in Alzheimer's disease (AD) cerebrospinal fluid (CSF) and extracellular fluid (ECF). Int J Biochem Mol Biol 3: 365–373. - PMC - PubMed
    1. Babiarz JE, Ruby JG, Wang Y, Bartel DP, Blelloch R 2008. Mouse ES cells express endogenous shRNAs, siRNAs, and other Microprocessor-independent, Dicer-dependent small RNAs. Genes Dev 22: 2773–2785. - PMC - PubMed
    1. Bachellerie JP, Cavaille J, Huttenhofer A 2002. The expanding snoRNA world. Biochimie 84: 775–790. - PubMed
    1. Benjamini Y, Hochberg Y 1995. Controlling the false discovery rate: a practical and powerful approach to multiple testing. J R Stat Soc Series B (Methodol) 57: 289–300.
    1. Birney E, Stamatoyannopoulos JA, Dutta A, Guigo R, Gingeras TR, Margulies EH, Weng Z, Snyder M, Dermitzakis ET, Thurman RE, et al.2007. Identification and analysis of functional elements in 1% of the human genome by the ENCODE pilot project. Nature 447: 799–816. - PMC - PubMed

Publication types

MeSH terms