

High-resolution genetic mapping in the diversity outbred mouse population identifies Apobec1 as a candidate gene for atherosclerosis
- PMID: 25344410
- PMCID: PMC4267931
- DOI: 10.1534/g3.114.014704
High-resolution genetic mapping in the diversity outbred mouse population identifies Apobec1 as a candidate gene for atherosclerosis
Abstract
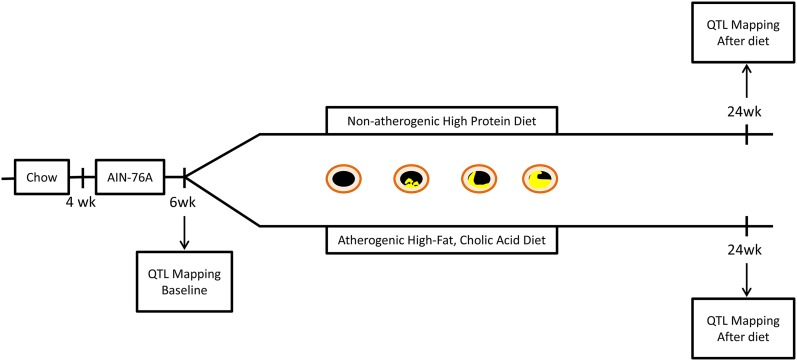
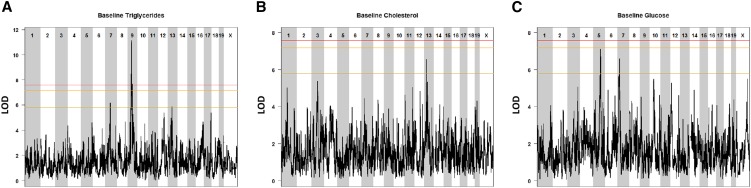
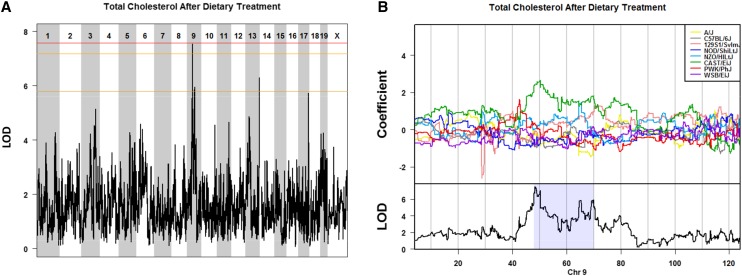
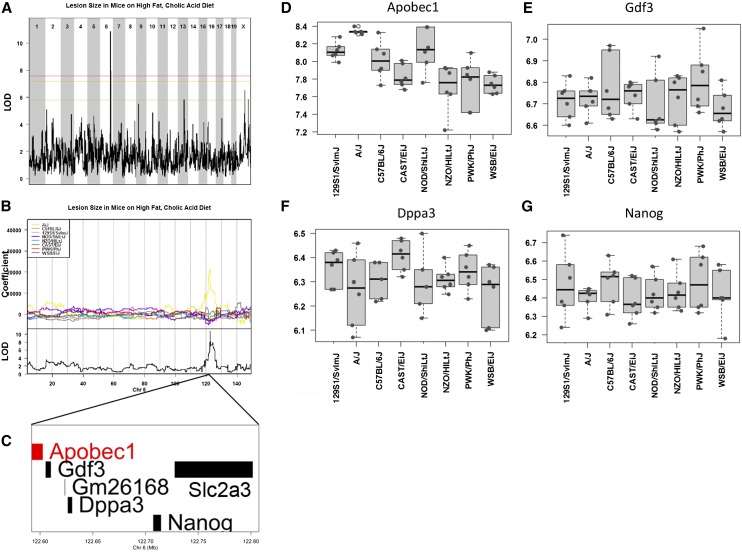
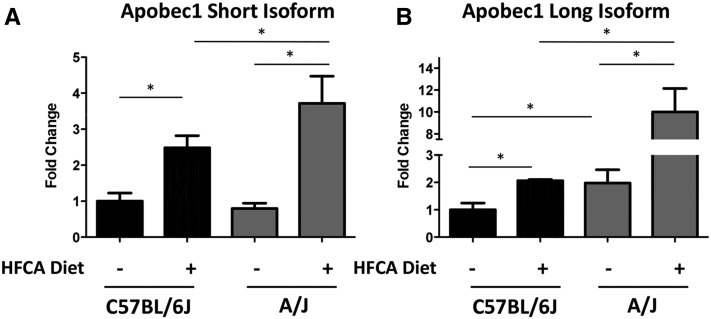
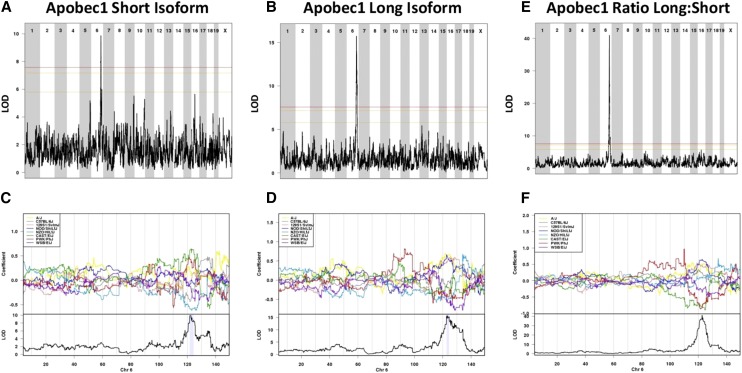
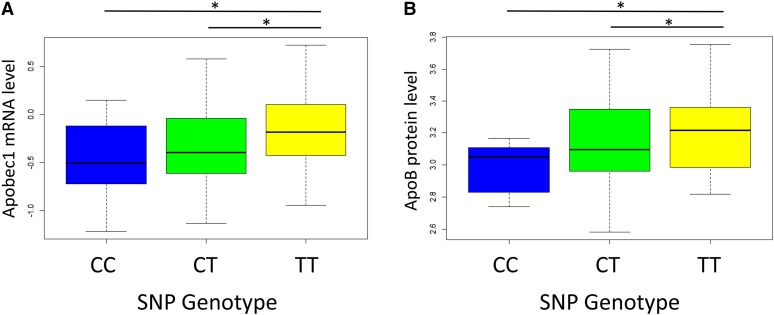
Inbred mice exhibit strain-specific variation in susceptibility to atherosclerosis and dyslipidemia that renders them useful in dissecting the genetic architecture of these complex diseases. Traditional quantitative trait locus (QTL) mapping studies using inbred strains often identify large genomic regions, containing many genes, due to limited recombination and/or sample size. This hampers candidate gene identification and translation of these results into possible risk factors and therapeutic targets. An alternative approach is the use of multiparental outbred lines for genetic mapping, such as the Diversity Outbred (DO) mouse panel, which can be more informative than traditional two-parent crosses and can aid in the identification of causal genes and variants associated with QTL. We fed 292 female DO mice either a high-fat, cholesterol-containing (HFCA) diet, to induce atherosclerosis, or a low-fat, high-protein diet for 18 wk and measured plasma lipid levels before and after diet treatment. We measured markers of atherosclerosis in the mice fed the HFCA diet. The mice were genotyped on a medium-density single-nucleotide polymorphism array and founder haplotypes were reconstructed using a hidden Markov model. The reconstructed haplotypes were then used to perform linkage mapping of atherosclerotic lesion size as well as plasma total cholesterol, triglycerides, insulin, and glucose. Among our highly significant QTL we detected a ~100 kb QTL interval for atherosclerosis on Chromosome 6, as well as a 1.4 Mb QTL interval on Chromosome 9 for triglyceride levels at baseline and a coincident 22.2 Mb QTL interval on Chromosome 9 for total cholesterol after dietary treatment. One candidate gene within the Chromosome 6 peak region associated with atherosclerosis is Apobec1, the apolipoprotein B (ApoB) mRNA-editing enzyme, which plays a role in the regulation of ApoB, a critical component of low-density lipoprotein, by editing ApoB mRNA. This study demonstrates the value of the DO population to improve mapping resolution and to aid in the identification of potential therapeutic targets for cardiovascular disease. Using a DO mouse population fed an HFCA diet, we were able to identify an A/J-specific isoform of Apobec1 that contributes to atherosclerosis.
Keywords: MPP; Multiparent Advanced Generation Inter-Cross (MAGIC); atherosclerosis; lipoproteins; multiparental models; multiparental populations; quantitative trait loci.
Copyright © 2014 Smallwood et al.
Figures

Similar articles
-
Complete phenotypic characterization of apobec-1 knockout mice with a wild-type genetic background and a human apolipoprotein B transgenic background, and restoration of apolipoprotein B mRNA editing by somatic gene transfer of Apobec-1.J Biol Chem. 1996 Oct 18;271(42):25981-8. doi: 10.1074/jbc.271.42.25981. J Biol Chem. 1996. PMID: 8824235
-
Quantitative trait locus mapping methods for diversity outbred mice.G3 (Bethesda). 2014 Sep 18;4(9):1623-33. doi: 10.1534/g3.114.013748. G3 (Bethesda). 2014. PMID: 25237114 Free PMC article.
-
Genetic Architectures of Quantitative Variation in RNA Editing Pathways.Genetics. 2016 Feb;202(2):787-98. doi: 10.1534/genetics.115.179481. Epub 2015 Nov 27. Genetics. 2016. PMID: 26614740 Free PMC article.
-
QTL mapping in outbred populations: successes and challenges.Physiol Genomics. 2014 Feb 1;46(3):81-90. doi: 10.1152/physiolgenomics.00127.2013. Epub 2013 Dec 10. Physiol Genomics. 2014. PMID: 24326347 Free PMC article. Review.
-
The Collaborative Cross mouse model for dissecting genetic susceptibility to infectious diseases.Mamm Genome. 2018 Aug;29(7-8):471-487. doi: 10.1007/s00335-018-9768-1. Epub 2018 Aug 24. Mamm Genome. 2018. PMID: 30143822 Review.
Cited by
-
microRNA-146a-5p association with the cardiometabolic disease risk factor TMAO.Physiol Genomics. 2019 Feb 1;51(2):59-71. doi: 10.1152/physiolgenomics.00079.2018. Epub 2019 Jan 11. Physiol Genomics. 2019. PMID: 30633643 Free PMC article.
-
Dissecting the Genetic Architecture of Cystatin C in Diversity Outbred Mice.G3 (Bethesda). 2020 Jul 7;10(7):2529-2541. doi: 10.1534/g3.120.401275. G3 (Bethesda). 2020. PMID: 32467129 Free PMC article.
-
Genetic background influences susceptibility to chemotherapy-induced hematotoxicity.Pharmacogenomics J. 2018 Apr;18(2):319-330. doi: 10.1038/tpj.2017.23. Epub 2017 Jun 13. Pharmacogenomics J. 2018. PMID: 28607509 Free PMC article.
-
Contrasting genetic architectures in different mouse reference populations used for studying complex traits.Genome Res. 2015 Jun;25(6):775-91. doi: 10.1101/gr.187450.114. Epub 2015 May 7. Genome Res. 2015. PMID: 25953951 Free PMC article. Review.
-
Facial shape and allometry quantitative trait locus intervals in the Diversity Outbred mouse are enriched for known skeletal and facial development genes.PLoS One. 2020 Jun 5;15(6):e0233377. doi: 10.1371/journal.pone.0233377. eCollection 2020. PLoS One. 2020. PMID: 32502155 Free PMC article.
References
-
- Charlton-Menys V., Durrington P. N., 2005. Apolipoprotein A5 and hypertriglyceridemia. Clin. Chem. 51: 295–297. - PubMed
Publication types
MeSH terms
Substances
Grants and funding
LinkOut - more resources
Full Text Sources
Other Literature Sources
Medical
Molecular Biology Databases
Miscellaneous