. 2014 Oct 24;2(10):e12175.
doi: 10.14814/phy2.12175. Print 2014 Oct 1.

cAMP controls the restoration of endothelial barrier function after thrombin-induced hyperpermeability via Rac1 activation

Affiliations

cAMP controls the restoration of endothelial barrier function after thrombin-induced hyperpermeability via Rac1 activation

Muhammad Aslam et al. Physiol Rep. .

Abstract

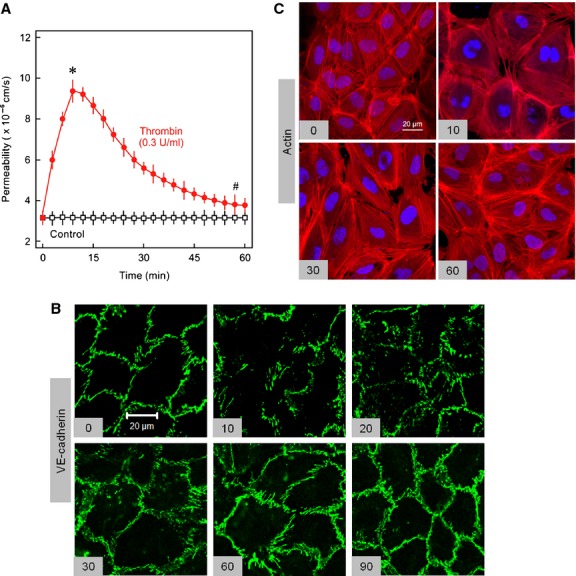
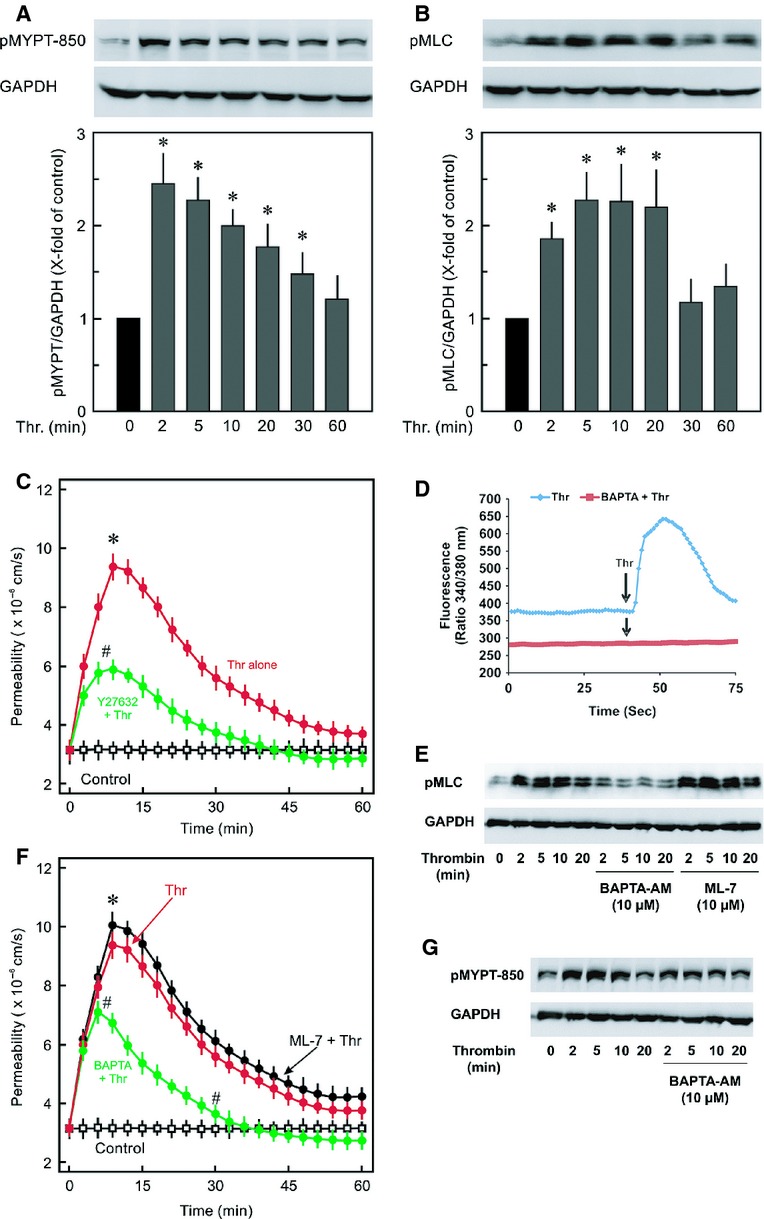
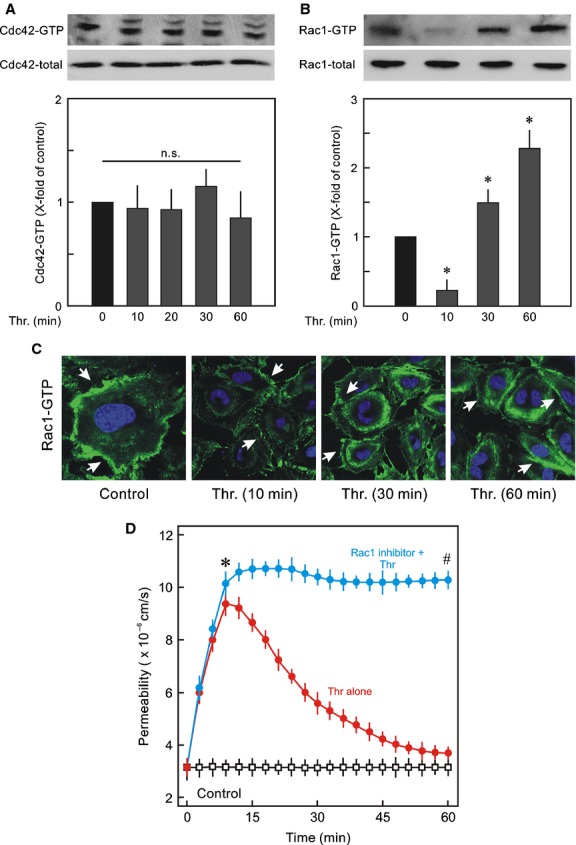
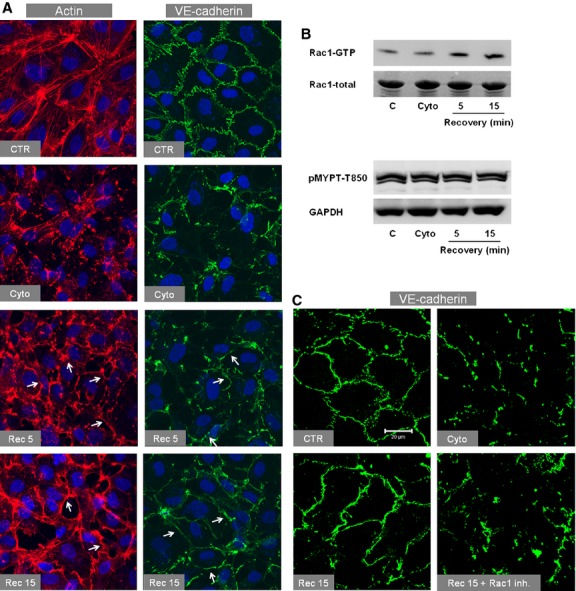
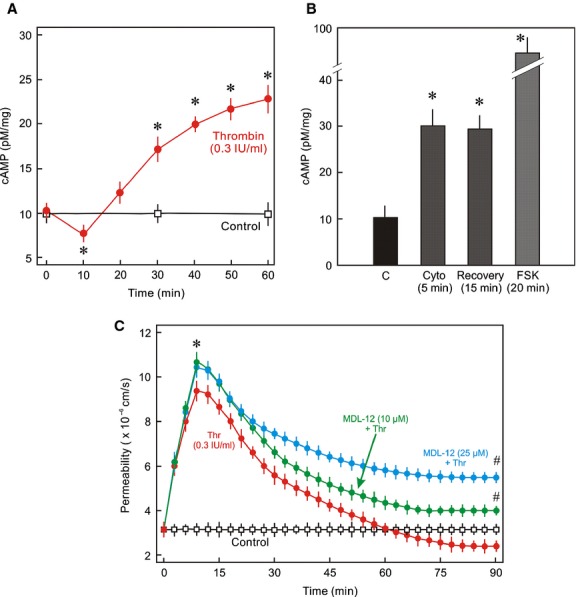
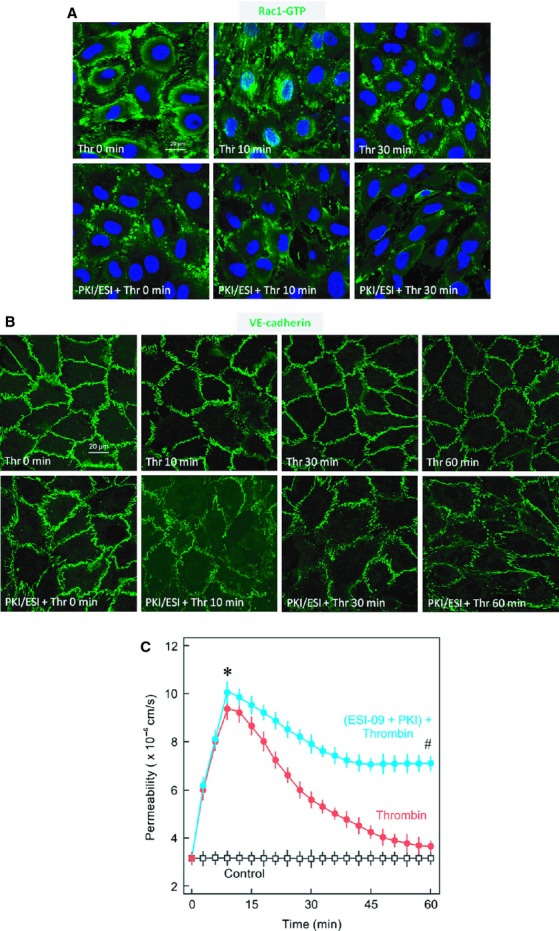
Inflammatory mediators like thrombin disrupt endothelial adherens junctions (AJs) and barrier integrity leading to oedema formation followed by resealing of AJs and a slow recovery of the barrier function. The molecular mechanisms of this process have not yet been fully delineated. The aim of the present study was to analyse the molecular mechanism of endothelial barrier recovery and thrombin was used as model inflammatory mediator. Thrombin caused a strong increase in endothelial permeability within 10 min accompanied by loss of Rac1 but not cdc42 activity, drop in cellular cAMP contents, and a strong activation of the endothelial contractile machinery mainly via RhoA/Rock signalling. Activation of RhoA/Rock signalling precedes and is dependent upon a rise in the cytosolic Ca(2+) concentration. Inhibition of cytosolic Ca(2+) rise but not MLCK or Rock enhances the recovery of endothelial barrier function. The cellular cAMP contents increased gradually during the barrier recovery phase (30-60 min after thrombin challenge) accompanied by an increase in Rac1 activity. Inhibition of Rac1 activity using a specific pharmacological inhibitor (NSC23766) abrogated the endothelial barrier recovery process, suggesting a Rac1-dependent phenomenon. Likewise, inhibition of either adenylyl cyclase or the cAMP-effectors PKA and Epac (with PKI and ESI-09, respectively) caused an abrogation of Rac1 activation, resealing of endothelial AJs and recovery of endothelial barrier function. The data demonstrate that endothelial barrier recovery after thrombin challenge is regulated by Rac1 GTPase activation. This Rac1 activation is due to increased levels of cellular cAMP and activation of downstream signalling during the barrier recovery phase.

Keywords: Adenylyl cyclase; Rac1; RhoA; adherens junctions; calcium.


Figures

Figure 1.
Figure 1.
Dynamics of endothelial permeability, actin cytoskeleton, and AJs after thrombin challenge. (A) EC monolayers were exposed to thrombin (Thr; 0.3 IU/mL) or vehicle (control) as indicated and albumin flux (permeability) was measured as described in methods section. Mean ± SEM of three experiments of independent cell preparations, *P <0.05 versus control. (B) EC monolayers were exposed to thrombin (Thr; 0.3 IU/mL) for different time points (min) as indicated or vehicle, methanol fixed, and immunostained for VE‐cadherin or (C) paraformaldehyde (4%) fixed and stained with phalloidin‐TRITC for actin visualisation. Representative figures of three experiments of independent cell preparation.
Figure 2.
Figure 2.
Dynamics of RhoA activity, endothelial contractile machinery, and cytosolic Ca2+. EC monolayers were exposed to thrombin (Thr; 0.3 IU/mL) for different time points or vehicle (0 min; control) as indicated and samples were collected in Laemmli buffer and subjected to Western blot analysis for (A) MYPT1 phosphorylation using a phosphospecific antibody to MYPT1 (Thr850) and (B) MLC phosphorylation using a phosphospecific antibody to MLC (S18/T19). GAPDH was used as loading control. Mean ± SEM of three experiments of independent cell preparations; *P < 0.05 versus C (0 min). (C) EC monolayers were exposed to thrombin (Thr; 0.3 IU/mL) in the absence or presence of Rock inhibitor Y27632 (10 μmol/L) or vehicle (control) as indicated and albumin flux (permeability) was measured. Mean ± SEM of three experiments of independent cell preparations; *P <0.05 versus control, #P <0.05 versus Thr alone. (D) Cytosolic Ca2+‐levels (Fura‐2 ratio) was measured as detailed in methods. The graph shows collective mean data of at least 100 cells from one measurement. Representative graph of three experiments from independent cell preparation. (E) MLC phosphorylation. EC monolayers were exposed to thrombin (Thr; 0.3 IU/mL) for different time points or vehicle (0 min; control) in the absence or presence of BAPTA‐AM or ML‐7 as indicated. Representative blots from three experiments with independent cell preparation. (F) EC monolayers were exposed to thrombin (Thr; 0.3 IU/mL) in the absence or presence of ML‐7 (10 μmol/L) or BAPTA‐AM (10 μmol/L) or vehicle (control) as indicated and albumin flux (permeability) was measured. Mean ± SEM of three experiments of independent cell preparations; *P <0.05 versus control, #P <0.05 versus Thr alone. (G) MYPT1 phosphorylation. EC monolayers were exposed to thrombin (Thr; 0.3 IU/mL) for different time points or vehicle (0 min; control) in the absence or presence of BAPTA‐AM as indicated. Representative blots from three experiments with independent cell preparation.
Figure 3.
Figure 3.
Dynamics of activities of cdc42 and Rac1. (A) Cdc42 activity; Representative Western blots of Rac1‐GTP and Rac1 total. EC monolayers were treated with thrombin (Thr; 0.3 IU/mL) for indicated time points or vehicle (0 min; control) and active Cdc42 was detected by pulldown assay. The active Cdc42 is given as x‐fold of control (0 min) taken as 1. Mean ± SEM of three experiments of independent cell preparations; n.s: not significantly different from control. (B) Rac1 activity; Representative Western blots of Rac1‐GTP and Rac1 total. The active Rac1 was detected by pulldown assay. The active Rac1 is given as x‐fold of control (0 min) taken as 1. Mean ± SEM of three experiments of independent cell preparations; *P < 0.05. (C) Localisation of active Rac1‐GTP in EC after thrombin treatment. EC monolayers were exposed to thrombin (Thr; 0.3 IU/mL) for different time points (min) as indicated or vehicle (control), PFA fixed, and immunostained for Rac1‐GTP using anti active Rac1 antibody. Representative images of three experiments of independent cell preparation. (D) EC monolayers were exposed to thrombin (Thr; 0.3 IU/mL) in the absence or presence of Rac1 inhibitor NSC23766 (50 μmol/L) or vehicle (control) as indicated and albumin flux (permeability) was measured. Mean ± SEM of three experiments of independent cell preparations; *P <0.05 versus control, #P <0.05 versus Thr alone.
Figure 4.
Figure 4.
Effect of actin depolymerisation on VE‐cadherin and RhoA and Rac1 activities. (A) Effect of cytochalasin D (cyto) on actin (left) and VE‐cadherin (right). EC monolayers were treated with cyto (1 μmol/L) or vehicle (CTR; control) for 5 min. After that cyto was washed off and cells were incubated with fresh medium for indicated time points, fixed with paraformaldehyde (actin) or methanol (VE‐cadherin), and immunostained for VE‐cadherin or F‐actin (TRITC‐labelled phalloidin). Arrows denote actin or VE‐cadherin localised at cell borders (representative images of three experiments of independent cell preparations). (B) Effect of cytochalasin D (cyto) on Rac1 (upper) and RhoA/Rock signalling (lower). Representative Western blots of three experiments of independent cell preparations. EC monolayers were treated with cyto (1 μmol/L) or vehicle (CTR; control) for 5 min. After that cyto was washed off and cells were incubated with fresh medium for indicated time points, cells collected in lysis buffer. Rac1 activation was analysed by pulldown assay while activation of RhoA/Rock signalling was analysed measuring the phosphorylation of MYPT1 at T850. (C) Effect of Rac1 inhibition on reappearance of VE‐cadherin at cell‐cell junctions during the recovery. EC monolayers were treated with cyto (1 μmol/L) or vehicle (CTR; control) for 5 min. After cyto was washed off cells were incubated with fresh medium for 15 min in the absence or presence of Rac1 inhibitor (NSC23766; 50 μmol/L) and cells were immunostained for VE‐cadherin. (Scale bar 20 μm; representative images of three experiments of independent cell preparations). [Rec 5: recovery after 5 min, Rec 15: recovery after 15 min.]
Figure 5.
Figure 5.
Dynamics of intracellular cAMP levels during EC barrier restoration. (A) Intracellular cAMP levels during the recovery. EC monolayers were treated with thrombin (Thr; 0.3 IU/mL) or vehicle (C; control) for indicated time periods and cAMP levels were measured by ELISA (Mean ± SEM of three experiments of independent cell preparations, *P < 0.05). (B) EC monolayers were treated with cytochalasin D (cyto; 1 μmol/L), forskolin (FSK; 10 μmol/L) or vehicle (C; control) for indicated time points and cAMP levels were measured by ELISA. (Mean ± SEM of three experiments of independent cell preparations, *P < 0.05). (C) Effect of AC inhibition on EC barrier recovery. EC monolayers were exposed to thrombin (Thr; 0.3 IU/mL) in the absence or presence of AC inhibitor MDL12330 (10 and 25 μmol/L) or vehicle (control) as indicated and albumin flux (permeability) was measured. Mean ± SEM of three experiments of independent cell preparations; *P <0.05 versus control, #P <0.05 versus Thr alone.
Figure 6.
Figure 6.
Role of cAMP signalling in Rac1 activation and barrier restoration. (A) Effect of inhibition of cAMP signalling on Rac1 activation. EC monolayers were treated with thrombin (Thr; 0.3 IU/mL) or vehicle (Thr 0 min) for indicated time periods in the absence or presence of PKA and Epac inhibitors (PKI; 10 μmol/L and ESI‐09; 3 μmol/L, respectively) and immunostained for active Rac1 (Rac1‐GTP) using a specific antibody directed against Rac1‐GTP. Nuclei were stained with DAPI. Representative images of Rac1‐GTP from three experiments of independent cell preparation. (B) Effect of inhibition of cAMP signalling on VE‐cadherin localisation. EC monolayers were treated with thrombin (Thr; 0.3 IU/mL) or vehicle (Thr 0 min) for indicated time periods in the absence or presence of PKA and Epac inhibitors (PKI; 10 μmol/L and ESI‐09; 3 μmol/L, respectively) and immunostained for VE‐cadherin using specific antibody directed against VE‐cadherin. Representative images of Rac1‐GTP from three experiments of independent cell preparation. (C) EC monolayers were exposed to thrombin (Thr; 0.3 IU/mL) in the absence or presence of PKA and Epac inhibitors (PKI; 10 μmol/L and ESI‐09; 3 μmol/L, respectively) or vehicle (control) as indicated and albumin flux (permeability) was measured. Mean ± SEM of three experiments of independent cell preparations; *P <0.05 versus control, #P <0.05 versus Thr alone.

References

    1. Adamson R. H., Zeng M., Adamson G. N., Lenz J. F., Curry F. E. 2003. PAF‐ and bradykinin‐induced hyperpermeability of rat venules is independent of actin‐myosin contraction. Am. J. Physiol. Heart Circ. Physiol.; 285:H406-H417. - PubMed
    1. Almahariq M., Tsalkova T., Mei F. C., Chen H., Zhou J., Sastry S. K. 2013. A novel EPAC specific inhibitor suppresses pancreatic cancer cell migration and invasion. Mol. Pharmacol.; 83:122-128. - PMC - PubMed
    1. Aslam M., Härtel F. V., Arshad M., Gündüz D., Abdallah Y., Sauer H. 2010. cAMP/PKA antagonizes thrombin‐induced inactivation of endothelial myosin light chain phosphatase: Role of CPI‐17. Cardiovasc. Res.; 87:375-384. - PubMed
    1. Aslam M., Pfeil U., Gündüz D., Rafiq A., Kummer W., Piper H. M. 2012. Intermedin/adrenomedullin2 stabilises endothelial barrier and antagonises thrombin‐induced barrier failure. Br. J. Pharmacol.; 165:208-222. - PMC - PubMed
    1. Aslam M., Schlüter K. D., Rohrbach S., Rafiq A., Nazli S., Piper H. M. 2013. Hypoxia/reoxygenation‐induced endothelial barrier failure: role of RhoA, Rac1, and MLCK. J. Physiol.; 591:461-473. - PMC - PubMed

LinkOut - more resources