

Lipoprotein subclass metabolism in nonalcoholic steatohepatitis
- PMID: 25344588
- PMCID: PMC4242459
- DOI: 10.1194/jlr.P054387
Lipoprotein subclass metabolism in nonalcoholic steatohepatitis
Erratum in
-
ERRATUM.J Lipid Res. 2016 Apr;57(4):743. doi: 10.1194/jlr.M054387ERR. J Lipid Res. 2016. PMID: 27037362 Free PMC article. No abstract available.
Abstract
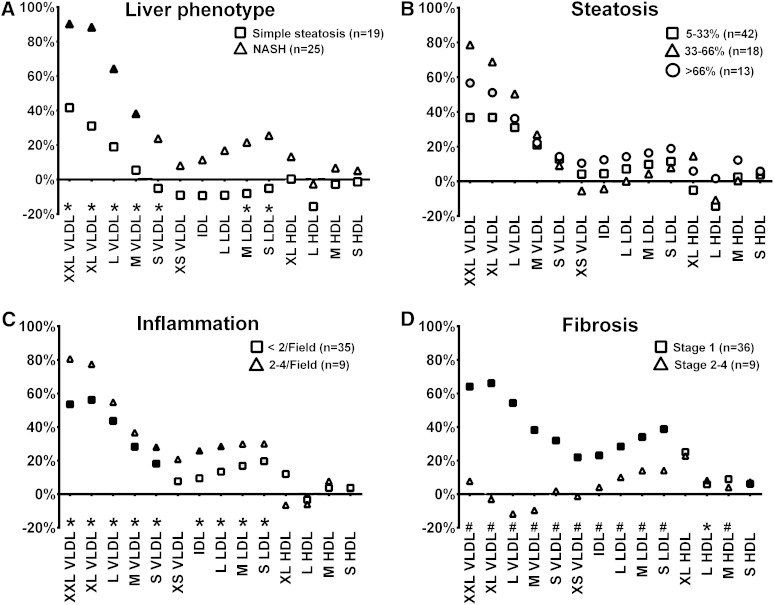
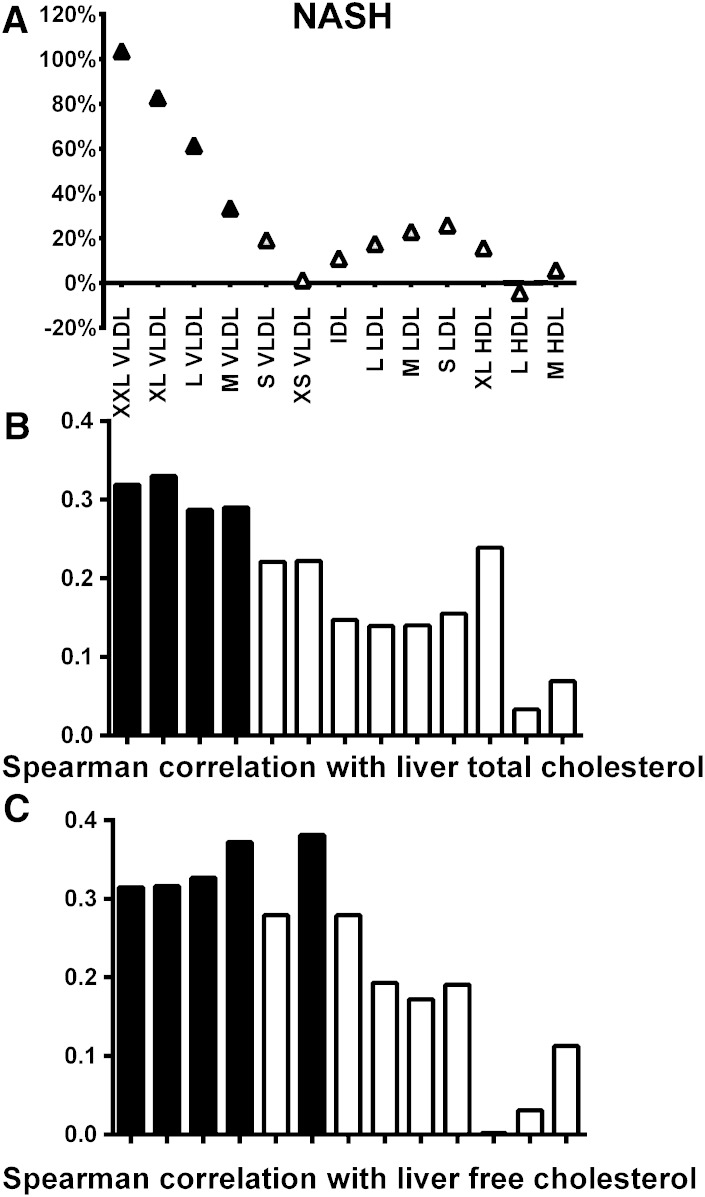
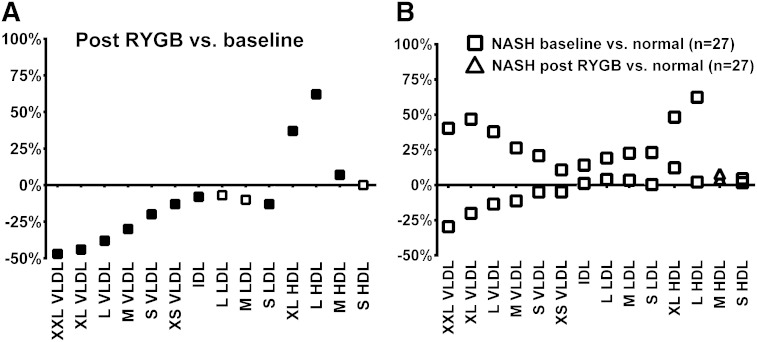
Nonalcoholic steatohepatitis (NASH) is associated with increased synthesis of triglycerides and cholesterol coupled with increased VLDL synthesis in the liver. In addition, increased cholesterol content in the liver associates with NASH. Here we study the association of lipoprotein subclass metabolism with NASH. To this aim, liver biopsies from 116 morbidly obese individuals [age 47.3 ± 8.7 (mean ± SD) years, BMI 45.1 ± 6.1 kg/m², 39 men and 77 women] were used for histological assessment. Proton NMR spectroscopy was used to measure lipid concentrations of 14 lipoprotein subclasses in native serum samples at baseline and after obesity surgery. We observed that total lipid concentration of VLDL and LDL subclasses, but not HDL subclasses, associated with NASH [false discovery rate (FDR) < 0.1]. More specifically, total lipid and cholesterol concentration of VLDL and LDL subclasses associated with inflammation, fibrosis, and cell injury (FDR < 0.1), independent of steatosis. Cholesterol concentration of all VLDL subclasses also correlated with total and free cholesterol content in the liver. All NASH-related changes in lipoprotein subclasses were reversed by obesity surgery. High total lipid and cholesterol concentration of serum VLDL and LDL subclasses are linked to cholesterol accumulation in the liver and to liver cell injury in NASH.
Keywords: high density lipoprotein; lipids; lipoproteins/metabolism; liver; low density lipoprotein; nuclear magnetic resonance; obesity; obesity surgery; very low density lipoprotein.
Copyright © 2014 by the American Society for Biochemistry and Molecular Biology, Inc.
Figures
Similar articles
-
Impact of obeticholic acid on the lipoprotein profile in patients with non-alcoholic steatohepatitis.J Hepatol. 2020 Jan;72(1):25-33. doi: 10.1016/j.jhep.2019.10.006. Epub 2019 Oct 18. J Hepatol. 2020. PMID: 31634532 Free PMC article. Clinical Trial.
-
Effects of insulin resistance and type 2 diabetes on lipoprotein subclass particle size and concentration determined by nuclear magnetic resonance.Diabetes. 2003 Feb;52(2):453-62. doi: 10.2337/diabetes.52.2.453. Diabetes. 2003. PMID: 12540621
-
Oxidized low-density lipoprotein antibodies/high-density lipoprotein cholesterol ratio is linked to advanced non-alcoholic fatty liver disease lean patients.J Gastroenterol Hepatol. 2016 Sep;31(9):1611-8. doi: 10.1111/jgh.13335. J Gastroenterol Hepatol. 2016. PMID: 26946071
-
Metabolic-associated fatty liver disease and lipoprotein metabolism.Mol Metab. 2021 Aug;50:101238. doi: 10.1016/j.molmet.2021.101238. Epub 2021 Apr 20. Mol Metab. 2021. PMID: 33892169 Free PMC article. Review.
-
Increased very low density lipoprotein (VLDL) secretion, hepatic steatosis, and insulin resistance.Trends Endocrinol Metab. 2011 Sep;22(9):353-63. doi: 10.1016/j.tem.2011.04.007. Epub 2011 May 26. Trends Endocrinol Metab. 2011. PMID: 21616678 Free PMC article. Review.
Cited by
-
Novel Lipid Long Intervening Noncoding RNA, Oligodendrocyte Maturation-Associated Long Intergenic Noncoding RNA, Regulates the Liver Steatosis Gene Stearoyl-Coenzyme A Desaturase As an Enhancer RNA.Hepatol Commun. 2019 Aug 14;3(10):1356-1372. doi: 10.1002/hep4.1413. eCollection 2019 Oct. Hepatol Commun. 2019. PMID: 31592021 Free PMC article.
-
Diabetes medication associates with DNA methylation of metformin transporter genes in the human liver.Clin Epigenetics. 2017 Sep 21;9:102. doi: 10.1186/s13148-017-0400-0. eCollection 2017. Clin Epigenetics. 2017. PMID: 28947922 Free PMC article.
-
Indole-3-Propionic Acid, a Gut-Derived Tryptophan Metabolite, Associates with Hepatic Fibrosis.Nutrients. 2021 Oct 5;13(10):3509. doi: 10.3390/nu13103509. Nutrients. 2021. PMID: 34684510 Free PMC article.
-
Serum aromatic and branched-chain amino acids associated with NASH demonstrate divergent associations with serum lipids.Liver Int. 2021 Apr;41(4):754-763. doi: 10.1111/liv.14743. Epub 2020 Dec 5. Liver Int. 2021. PMID: 33219609 Free PMC article.
-
Multi-omics characterization of a diet-induced obese model of non-alcoholic steatohepatitis.Sci Rep. 2020 Jan 24;10(1):1148. doi: 10.1038/s41598-020-58059-7. Sci Rep. 2020. PMID: 31980690 Free PMC article.
References
-
- Musso G., Gambino R., Cassader M. 2010. Non-alcoholic fatty liver disease from pathogenesis to management: an update. Obes. Rev. 11: 430–445. - PubMed
-
- Vernon G., Baranova A., Younossi Z. M. 2011. Systematic review: the epidemiology and natural history of non-alcoholic fatty liver disease and non-alcoholic steatohepatitis in adults. Aliment. Pharmacol. Ther. 34: 274–285. - PubMed
-
- Adiels M., Taskinen M. R., Packard C., Caslake M. J., Soro-Paavonen A., Westerbacka J., Vehkavaara S., Hakkinen A., Olofsson S. O., Yki-Jarvinen H., et al. 2006. Overproduction of large VLDL particles is driven by increased liver fat content in man. Diabetologia. 49: 755–765. - PubMed
-
- Kotronen A., Yki-Järvinen H. 2008. Fatty liver: a novel component of the metabolic syndrome. Arterioscler. Thromb. Vasc. Biol. 28: 27–38. - PubMed
Publication types
MeSH terms
Substances
Grants and funding
LinkOut - more resources
Full Text Sources
Other Literature Sources
Medical
