. 2014 Dec;11(12):1261-6.
doi: 10.1038/nmeth.3147. Epub 2014 Oct 26.

Permanent genetic memory with >1-byte capacity

Affiliations

Permanent genetic memory with >1-byte capacity

Lei Yang et al. Nat Methods. 2014 Dec.

Abstract

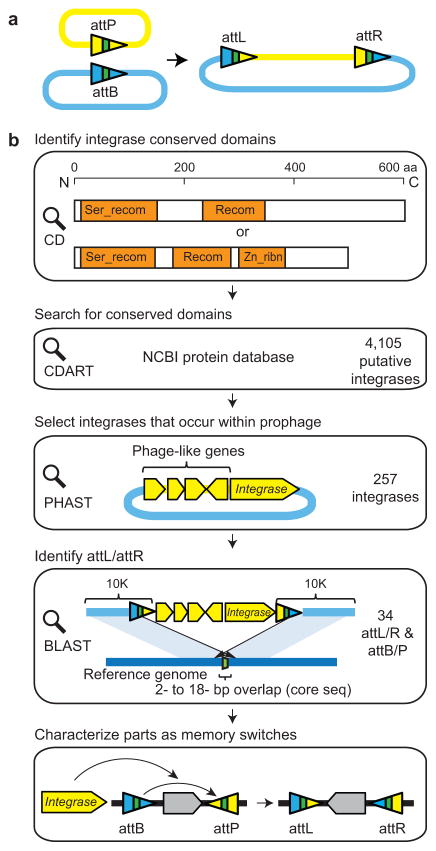
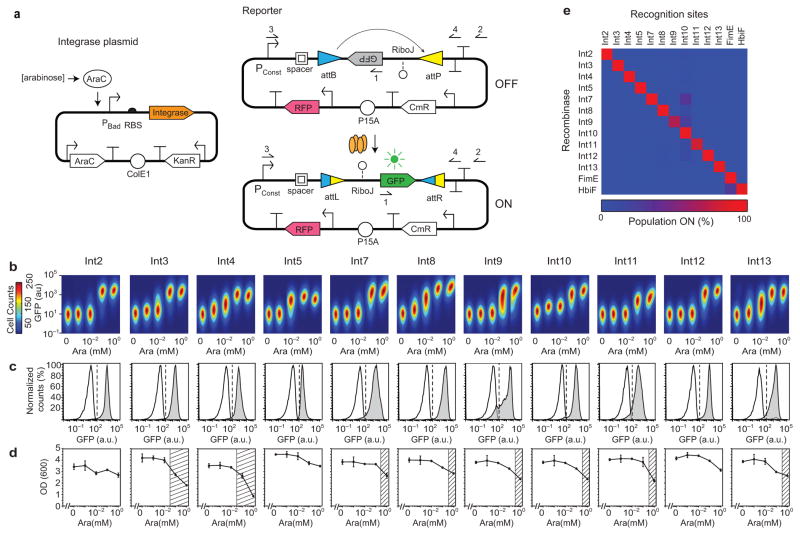
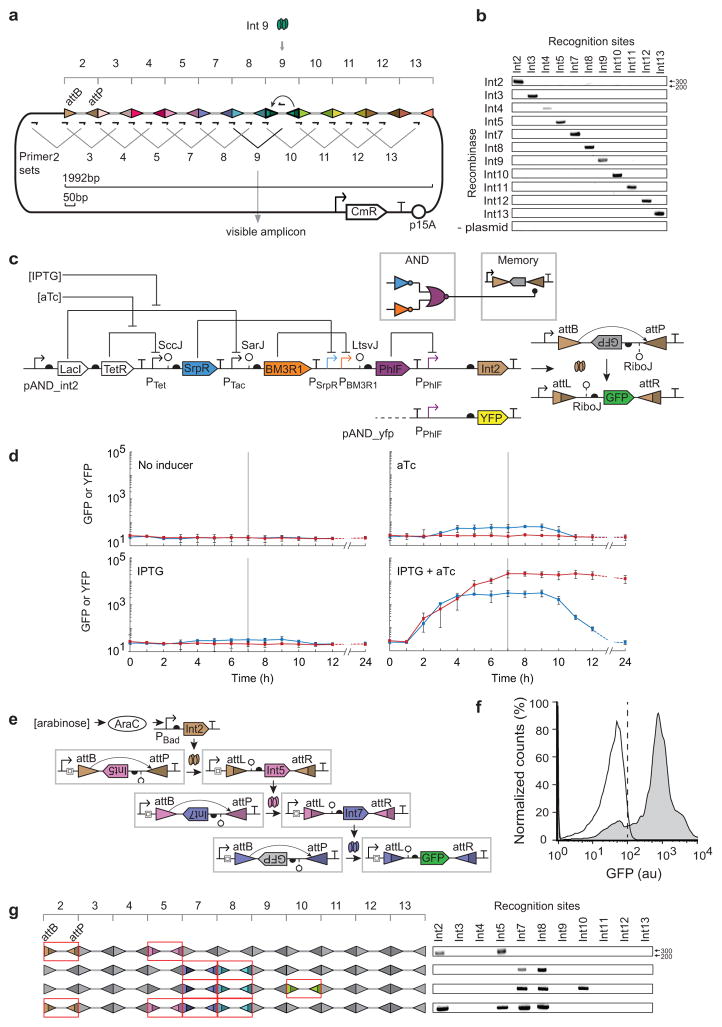
Genetic memory enables the recording of information in the DNA of living cells. Memory can record a transient environmental signal or cell state that is then recalled at a later time. Permanent memory is implemented using irreversible recombinases that invert the orientation of a unit of DNA, corresponding to the [0,1] state of a bit. To expand the memory capacity, we have applied bioinformatics to identify 34 phage integrases (and their cognate attB and attP recognition sites), from which we build 11 memory switches that are perfectly orthogonal to each other and the FimE and HbiF bacterial invertases. Using these switches, a memory array is constructed in Escherichia coli that can record 1.375 bytes of information. It is demonstrated that the recombinases can be layered and used to permanently record the transient state of a transcriptional logic gate.


Conflict of interest statement

COMPETING FINANCIAL INTERESTS

The authors declare no competing financial interests.

Figures

Figure 1
Figure 1. Discovery of phage recombinases and their recognition sites.(a)
LSTP integrases catalyze insertion of phage genome (yellow) into the bacterial genome (blue) between attB and attP sites, which form hybrid attL and attR sites (triangles). The colors illustrate the sequence changes that occur during strand exchange with the core sequence shown in green. (b)Each step is shown from integrase discovery to the construction of a memory switch. See text for details. The domain structure (orange) is shown for phiC31 (top) and BxB1 (bottom). Blue lines indicate the bacterial genomic DNA and yellow regions correspond to prophage. The strategy for identifying recognition sites for prophage that occur within genes differs slightly and is provided in Supplementary Figure 1. (c) The phylogenetic tree is shown for the complete set of 34 integrases. The Genbank ID of the integrases and the attB/P sequences are provided in Supplementary Table 1. The < symbols mark those integrases used to build memory switches.
Figure 2
Figure 2. Memory switch characterization.(a)
The two-plasmid system is shown for assaying integrases and their recognition sites. The constitutive promoter (BBa_J23119) that controls GFP expression after DNA inversion is Pconst. Red fluorescent protein (RFP) is expressed from a constitutive promoter (BBa_J23101) in order to aid the gating of cells. The primer1, 2, 3 and 4 locations are used to assay the inversion event by PCR and sequencing. (b) An orthogonality matrix for the recombinases and their recognition sites is shown. The “Population ON” is the percent of cells above a GFP threshold of 102 au. The data represent the average of three independent replicates performed on different days (averages and standard deviations are provided in Supplementary Table 5). (c) The induction of each functional memory switch is shown. Five levels of arabinose induction are shown (left to right): 0, 10−3, 0.01, 0.1, and 1 mM. The heat map has the cell count, the height and width of the cell populations are the fluorescence from the green and red channels, respectively. The range of red fluorescence in each plot is 102.5–104.5 au on a log axis. The figure represents three experiments performed in different days. (d) Cytometry distributions of GFP fluorescence is shown before (white) and after (grey) arabinose. The dashed lines show the threshold at which cells are considered to be in the ON state (102 for all switches). Averages and error bars of three experiments performed in different days are shown in Supplemental Figure 3. (e)PCR bands amplified from cell cultures before (–) and after (+) arabinose induction using the primer 1 and 2 shown in part a. The expected band size is 0.8 kb. (f) The fraction of cells that are ON is shown versus time. Cells are induced at t = 0. (g) The impact on cell growth (OD 600nm) is shown as a function of arabinose concentration, corresponding to part b. The region where the growth rate is reduced by >25% is shown as a hashed region, chosen to be consistent with prior work. The average and standard deviation is shown for three independent experiments.
Figure 3
Figure 3. Incorporation of recombinases into larger genetic circuits. (a)
The memory array was designed as a linear concatenation of recognition sites for each integrase. A different 50bp spacer (grey thick line) was placed between each pair of recognition sites. Primer pairs were designed where one occurs at the interface between recognition sites and the second is within the spacer. Only when a spacer is inverted does the associated primer occur in the correct orientation to be amplified by PCR (~300bp). Int9 is shown as an example. (b) A DNA gel (1% agarose) is shown where the each primer set is used to determine which inversion event occurred. The “plasmid” control refers to a strain that contains only the memory array plasmid, but no integrase plasmid. (c) The memory array recording multiple bits of information is shown. Multiple integrase genes (Int2/5, Int7/8, Int7/8/10 or Int2/5/7/8) were organized in an operon controlled by an arabinose inducible promoter. The memory array after inversion is shown on the left. Only the attB/P sites that are switched are colored (same as part a) and indicated by the formation of attL/R. The DNA bands amplified using 11 primer sets described in Figure 3a are shown on the right. (d)The wiring diagram (colored by repressor) and genetic system for the AND gate connected to a memory switch is shown. The AND gate is also connected to an yfp gene to be used as a control. (e) Each panel shows a different combination of inducer. Blue lines show the fluorescence when the PPhlF promoter is fused directly to yfp and the red lines show when it induces Int2. Inducers were added at t = 0 hours and removed at t = 6 hours (horizontal line). The last time point was taken at 24 hours; the dashed lines are an extrapolation to that point accounting for dilution due to cell division. The error bars represent the standard deviation of three independent experiments performed on different days. (f) The 3-layer cascade of phage integrases is shown. Each integrase changes the orientation of the same constitutive promoter (BBa_J23101) and the same spacer and RiboJ insulator is used to insulate the integrases at each stage. (g) The cytometry distributions are shown for the cascade in the absence (white) and presence (grey) of inducer. The vertical dashed line demarcates the threshold used to determine whether cells are on or off. The figure represents three experiments performed in different days.

References

    1. Burrill DR, Silver PA. Making cellular memories. Cell. 2010;140:13–18. - PMC - PubMed
    1. Yamanishi M, Matsuyama T. A modified Cre-lox genetic switch to dynamically control metabolic flow in Saccharomyces cerevisiae. ACS Synth Biol. 2012;1:172–180. - PubMed
    1. Ham TS, Lee SK, Keasling JD, Arkin AP. A tightly regulated inducible expression system utilizing the fim inversion recombination switch. Biotechnol Bioeng. 2006;94:1–4. - PubMed
    1. Kawashima T, et al. Functional labeling of neurons and their projections using the synthetic activity-dependent promoter E-SARE. Nat Methods. 2013;10:889–895. - PubMed
    1. Zariwala HA, et al. A Cre-dependent GCaMP3 reporter mouse for neuronal imaging in vivo. J Neurosci. 2012;32:3131–3141. - PMC - PubMed

Publication types

MeSH terms