. 2014 Dec;46(12):1283-1292.
doi: 10.1038/ng.3122. Epub 2014 Oct 26.

Mutations in PLK4, encoding a master regulator of centriole biogenesis, cause microcephaly, growth failure and retinopathy

Affiliations

Mutations in PLK4, encoding a master regulator of centriole biogenesis, cause microcephaly, growth failure and retinopathy

Carol-Anne Martin et al. Nat Genet. 2014 Dec.

Abstract

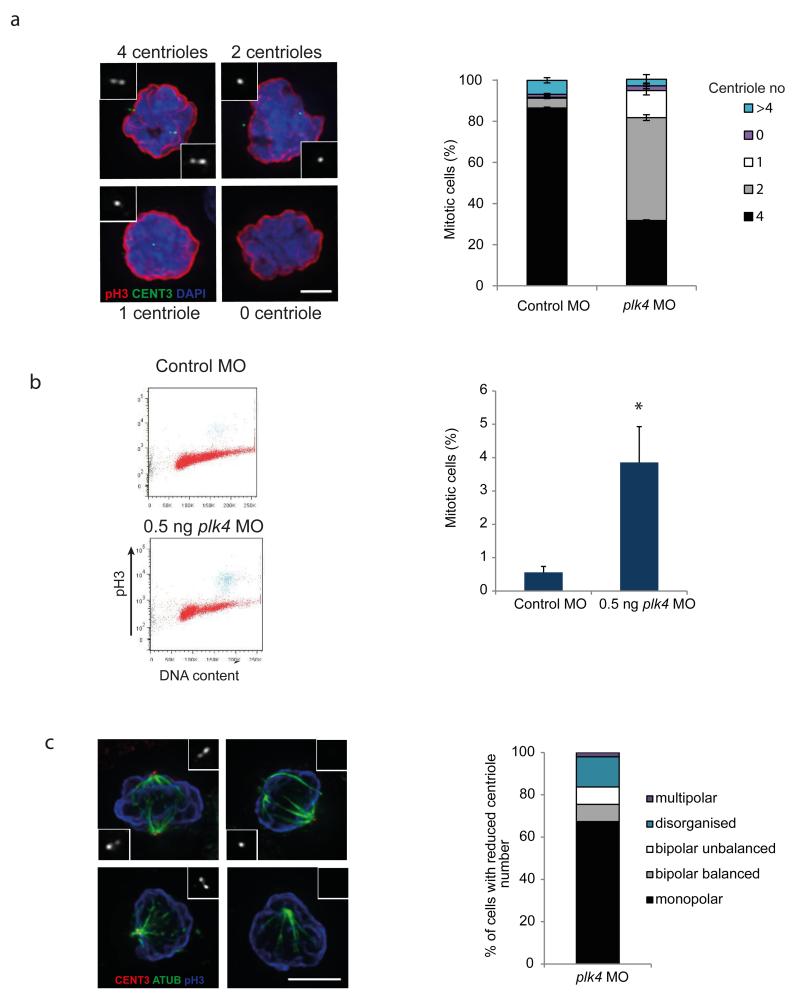
Centrioles are essential for ciliogenesis. However, mutations in centriole biogenesis genes have been reported in primary microcephaly and Seckel syndrome, disorders without the hallmark clinical features of ciliopathies. Here we identify mutations in the genes encoding PLK4 kinase, a master regulator of centriole duplication, and its substrate TUBGCP6 in individuals with microcephalic primordial dwarfism and additional congenital anomalies, including retinopathy, thereby extending the human phenotypic spectrum associated with centriole dysfunction. Furthermore, we establish that different levels of impaired PLK4 activity result in growth and cilia phenotypes, providing a mechanism by which microcephaly disorders can occur with or without ciliopathic features.


Figures

Figure 1
Figure 1. PLK4 and TUBGCP6 patients exhibit extreme microcephaly and short stature
a) Family 1, a large consanguineous Pakistani family with microcephalic primordial dwarfism. * indicates family members from whom DNA was available. b) Photographs of PLK4 and TUBGCP6 patients, P7, P9, P10, P11. c) Head circumference is disproportionately reduced relative to height. Growth parameters plotted as standard deviations (z-score) from the population mean for age and sex. Circles, PLK4; squares, TUBGCP6 patients. OFC, occipitofrontal circumference, Hgt, height. d) Axial T2 weighted MRI imaging showing that the cerebral cortex is substantially reduced in size with simplified gyral folding. P1 at 18 months (OFC −14.0 s.d) and P6 (OFC −9.0 s.d) at 20 years. Below, images from age-matched controls. Scale bar = 2cm.
Figure 2
Figure 2. Transcriptional and protein consequences of PLK4 mutations
a) Schematic of the human PLK4 gene. Coding exons (black), UTRs (white), alternatively spliced region in exon 5 (grey), arrow heads, RT-PCR primer positions. b) PLK4 protein domain structure. Kinase domain (KD)( grey), PEST sequences (1-3) (black), polo-box domains (PBD1-3) (blue/turquoise/green). Middle panel, the c.2811-5G>C mutation creates a new splice acceptor site that leads to retention of 4 bp of intron 15 sequence in the PLK4 mRNA, resulting in premature truncation of the protein at its C-terminus, disrupting the terminal polo-box domain (PB3). Lower panel depicts domain structure for the alternative isoform (ALT) resulting from use of an internal exon 5 splice donor site. c) Sequence electropherograms of the exon 15-16 junction of PLK4 amplified by RT-PCR from patient and control RNA. d) Alternative splicing of an internal exon 5 splice donor site is not detected in other vertebrates by RT-PCR. e) Levels of functional PLK4 are reduced to 25% of normal levels, in patients with the c.1299_1309delTAAAG mutation. Transcript levels plotted from quantitative RT-PCR on RNA extracted from patient primary fibroblast cell lines (n=3 experiments (exp), performed in triplicate; error bars, s.e.m). P value, two-tailed t-test *p≤0.05. Further details and characterization of PLK4 ALT and FL transcript levels, Fig. S5. f) Immunoblotting demonstrates reduced endogenous PLK4 protein levels in patient fibroblasts. Cell lysates of asynchronous cells. Left two lanes, RNAi of PLK4 in RPE1 cells demonstrating specificity of PLK4 antibody, with two PLK4-specific protein bands visualized. Remaining lanes, patient and control primary fibroblasts, upper panel standard exposure PLK4 immunoblot with middle panel overexposed to demonstrate residual detectable protein in P1 patient. Note also loss of the upper PLK4 band in P6 and P7. Lower panel, loading control, blot probed with anti-Actin antibody. g) PLK4 protein levels at the centrosome are reduced in patient fibroblasts. Top panel, representative immunofluorescence images of primary fibroblasts treated with 10μM MG132 for 5 hrs prior to fixation. (Specificity of the anti-PLK4 antibody confirmed by performing RNAi-mediated PLK4 depletion, Fig. S6). Scale bar = 10 μm. Bottom panel, quantitation of PLK4 protein levels at the centrosome by immunofluorescence analysis. Exp=3, n=50 cells/exp; error bars, s.e.m of n=150 cells. P value, two-tailed t-test ****p≤0.0001.
Figure 3
Figure 3. PLK4 mutations impair PLK4 activity in centriole biogenesis, resulting in reduced centriole number in patient cells
a,b) Centriole over duplication assay demonstrating that transfected FL and ALT PLK4 GFP-tagged constructs are competent for centriole duplication, while F433Lfs*6 and R936Sfs*1 have significantly reduced activity. a) representative images of Hela cells transfected for 48 hr with eGFP PLK4 constructs (immunoblot, Fig. S8) demonstrating centriole over duplication with FL and ALT, but not with truncated gene constructs representing patient mutations. Scale bar=4μm. b) Quantitation of experiments depicted in (i). n=100 cells /exp, exp=3, two tailed t-test *** p≤0.001 c,d) 6-12% of PLK4 patient fibroblasts have reduced centriole number at mitosis. c) Centrin foci quantified in prometaphase and metaphase fibroblasts (exp=3, n>200 cells/ exp). d) Quantification of centriole phenotypes observed in the 12% of mitotic P6 fibroblasts with reduced centriole number (fibroblasts with ≤2 centrioles (exp=3, n>175 cells). ‘2 together’ indicates 2 centrioles detected at one spindle pole, ‘2 separate’ indicates 2 centrioles detected, one at each pole. e) Mitotic spindle formation is impaired in PLK4 patient P6 fibroblasts with reduced centriole number. Left panel, representative images. Insets of centrin-3 staining are shown at 3 x magnification. ‘balanced’ cells, broad based bipolar spindle; ‘unbalanced’, unequal bipolar spindle; ‘monopolar’, only one spindle pole; ‘disorganised’, failure to establish a spindle pole. ATUB, α-tubulin. Scale bars=10μm. Right panel, quantification of the mitotic spindle phenotypes observed in the 12% of mitotic P6 fibroblasts with reduced centriole number (exp=3, n=75). Error bars, s.e.m. P value, two tailed t-test** ≤0.01, *≤0.05.
Figure 4
Figure 4. Depletion of plk4 causes dwarfism in zebrafish
a) Schematic of intron-exon structure of zebrafish plk4. Red bars indicate splice sites targeted by morpholino oligonucleotides (MO). RT-PCR primers (arrows). b) Dose dependent depletion of transcript levels in plk4 morphants. Transcript levels measured by quantitative RT-PCR of RNA extracted at 2 dpf. Transcript levels relative to 2 dpf control MO injected embryos (exp=3; error bars, s.e.m). c) Depletion of plk4 with 0.5 ng pooled MOs, results in small, morphologically normal, ‘dwarf’ zebrafish. Representative images of embryos at 5 dpf injected with either 0.5 ng plk4 MOs or 12 ng of control MO. d) Body surface area is significantly reduced in zebrafish injected with plk4 MO, at 5 dpf. Size can be rescued by coinjection of zebrafish (dr) plk4. Surface area expressed as a z-score relative to uninjected embryos of the same age (z-score defined as the standard deviations from the mean for uninjected embryo size at 5 dpf). P value, two-tailed t-test, ***≤0.001, versus control embryos; for RNA-coinjection rescue experiments, versus 1.5 ng plk4 MO alone. Error bars, s.e.m. e) Cell number is reduced in plk4 morphants. Time course from 0.5 - 48 hpf for plk4 MO concentrations as indicated. Error bars, s.e.m. f) Wild-type human PLK4 mRNA also partially rescues the growth phenotype, while mRNA encoding truncated protein products representing human mutations F433Lfs*6 and R936Sfs*1 do not complement the growth phenotype. n>50 embryos per experimental condition. exp =1. p value, two-tailed t-test. ** ≤0.01, *≤0.05, versus 1.5 ng plk4 MO alone. Error bars, s.e.m.
Figure 5
Figure 5. Impaired mitosis leads to growth retardation in plk4 morphant zebrafish
a) Centriole number is reduced in mitotic cells from plk4 morphants. Left, representative images of mitotic cells from 2 dpf embryos injected with control or plk4 MO. CENT3, centrin-3, pH3, phospho-Histone H3, marker of mitotic chromatin. Right, quantification of centrin-3 foci in 2 dpf zebrafish cells isolated from control MO or dwarf plk4 zebrafish (exp=2, n >100 mitoses/exp, error bars, s.e.m). b) Increased numbers of mitotic cells are present in 2 dpf zebrafish injected with 0.5 ng plk4 MO. Left, representative FACS plot of DNA content versus pH3 staining of single cell suspension from 2 dpf embryos Mitotic cells have 4N content and are pH3 positive (highlighted in blue). Sub-G1 cells (black). Right, quantification of 3 experiments (n=50 embryos/exp; error bars, s.e.m). c) Aberrant mitotic spindles are frequently seen in 2 dpf plk4 morphant embryos. Left, insets of centrin 3 staining are shown at 3x magnification. ATUB, α-tubulin. Scale bar, 5 μm. Right, quantification of mitotic phenotypes observed in plk4 morphant embryos with reduced centriole number (exp=1, n=50, error bars, s.d).
Figure 6
Figure 6. plk4 morphant zebrafish display retinal defects due to reduced cilia number
a) plk4 morphant zebrafish exhibit an impaired vision-dependent response, with reduced melanocyte constriction upon exposure to light. Left, representative images of melanocytes on the dorsal aspect of 5 dpf zebrafish in dark and light adapted conditions. Right, quantification of light adaptation using 0.5 – 3 ng plk4 MO at 5 dpf, exp=2 n> 50 embryos/exp. Error bars, s.e.m. b) Photoreceptor number is reduced in plk4 morphants. Confocal optical sections of 5 dpf zebrafish retina from plk4 and control morphants stained with zpf-1 (photoreceptors, black) and DAPI (grey). Eye size is also reduced in plk4 morphants at higher doses, while size reduction is variably present at the 0.5 ng dose (2 representative images shown at this dose). c) Cilia numbers are reduced in the photoreceptor layer of the retina in a dose-dependent manner in plk4 morphants and can be rescued by co-injection of PLK4 mRNA. Optical sections of 5 dpf zebrafish retina and higher magnification of photoreceptor cells (boxed region) below and right panels. zpr-1 (photoreceptors, green); AcTubulin, acetylated-tubulin (cilia axonemes, red), DAPI (white). ONL, outer nuclear layer; INL, inner nuclear layer.
Figure 7
Figure 7. Growth failure and ciliopathy phenotypes are separable in a dose dependent manner
a-d) Morphological ciliopathy phenotypes are evident at higher levels of plk4 depletion. a) 1.5 ng plk4 morphants at 5 dpf exhibit ciliopathy phenotypes, including dilated brain ventricles (arrow), pronephric duct cysts (arrow head) and ventral body axis curvature. b) Penetrance of ciliopathic phenotypes (scored by presence of ventral curvature) in 2 dpf plk4 morphant embryos injected with 0.5 – 3ng MO. c) Heart laterality defects are observed at 3 dpf in Tg(bre:egfp) zebrafish embryos injected with 3 ng plk4 MO, with loss of asymmetry (midline) or inversion of ventricle-atrium asymmetry (reversed) (A, atrium; V, ventricle). Right, quantification of heart laterality defects (exp=2, n>40 embryos). d) The proportion of ciliated cells is reduced in the Kupffer’s vesicles of 3 ng plk4 morphants. Left, representative images from control and 3 ng plk4 morphants at 16 hpf. aPKC, atypical protein kinase C (Kupffer’s vesicle marker, green); Ac-tubulin, acetylated tubulin, cilia (red). Right, quantification of cells ciliated in the Kupffer’s vesicle. e,f) Model of disease pathogenicity. e) Autoregulation of Plk4 results in a narrow window in which mutations impair enzymatic activity without resulting in embryonic lethality. At 50% transcript levels protein levels are normal. Further depletion of PLK4, as seen in PLK4 patients, leads to protein loss and growth defects. Additional loss of cellular PLK4 activity results in cilia-related phenotypes. f) Centriole duplication becomes inefficient at reduced PLK4 levels, with reduced centriole number impairing mitotic spindle formation and cell cycle progression. With severe reduction in PLK4 activity, cells completely lacking centrioles are generated, which are unable to form cilia, leading to ciliopathy phenotypes.

References

    1. Nigg EA, Raff JW. Centrioles, centrosomes, and cilia in health and disease. Cell. 2009;139:663–78. - PubMed
    1. Bettencourt-Dias M, Hildebrandt F, Pellman D, Woods G, Godinho SA. Centrosomes and cilia in human disease. Trends Genet. 2011;27:307–15. - PMC - PubMed
    1. Sir JH, et al. Loss of centrioles causes chromosomal instability in vertebrate somatic cells. J Cell Biol. 2013;203:747–56. - PMC - PubMed
    1. Ganem NJ, Godinho SA, Pellman D. A mechanism linking extra centrosomes to chromosomal instability. Nature. 2009;460:278–82. - PMC - PubMed
    1. Gonczy P. Towards a molecular architecture of centriole assembly. Nat Rev Mol Cell Biol. 2012;13:425–35. - PubMed

Publication types

MeSH terms

Substances