. 2014 Dec;15(12):1134-42.
doi: 10.1038/ni.3028. Epub 2014 Oct 26.

A narrow repertoire of transcriptional modules responsive to pyogenic bacteria is impaired in patients carrying loss-of-function mutations in MYD88 or IRAK4

Affiliations

A narrow repertoire of transcriptional modules responsive to pyogenic bacteria is impaired in patients carrying loss-of-function mutations in MYD88 or IRAK4

Laia Alsina et al. Nat Immunol. 2014 Dec.

Abstract

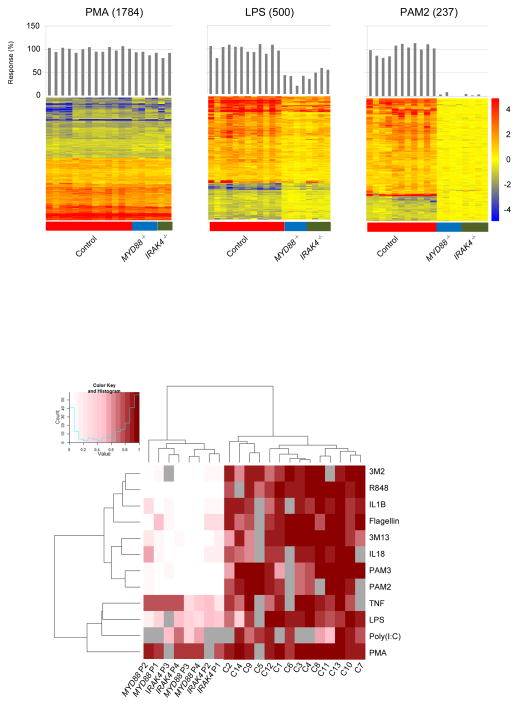
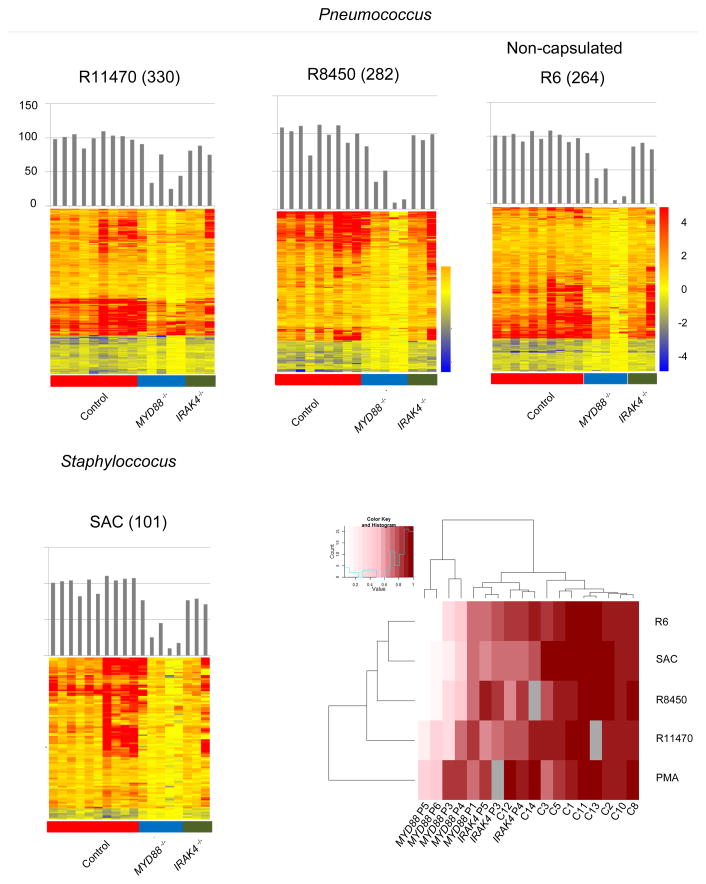
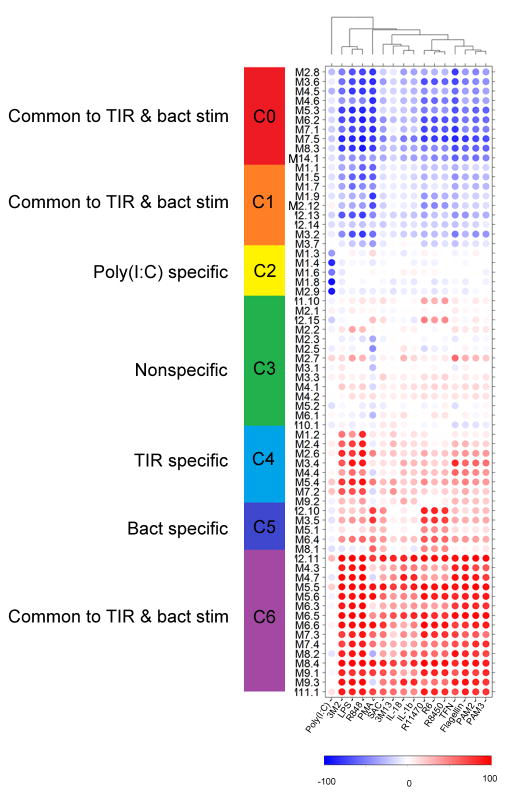
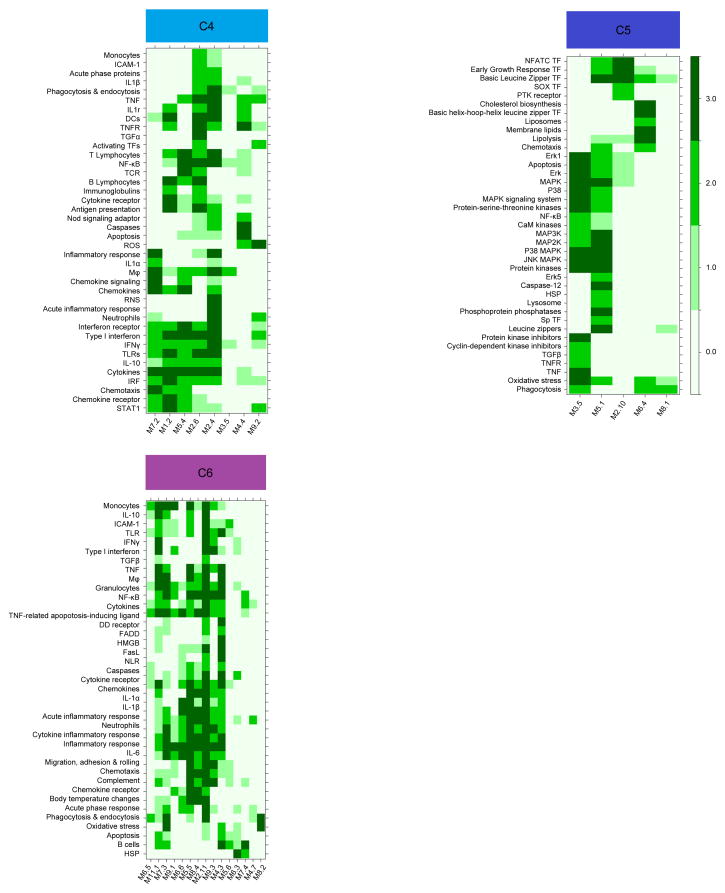
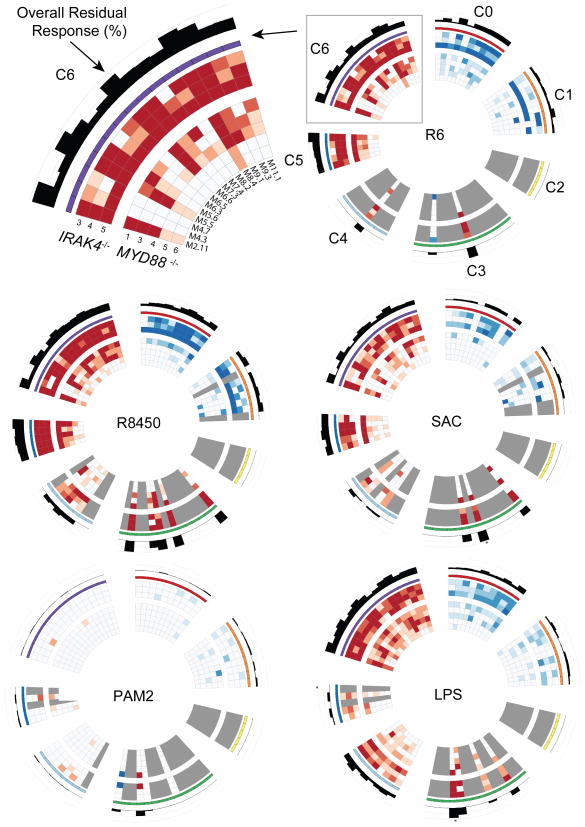
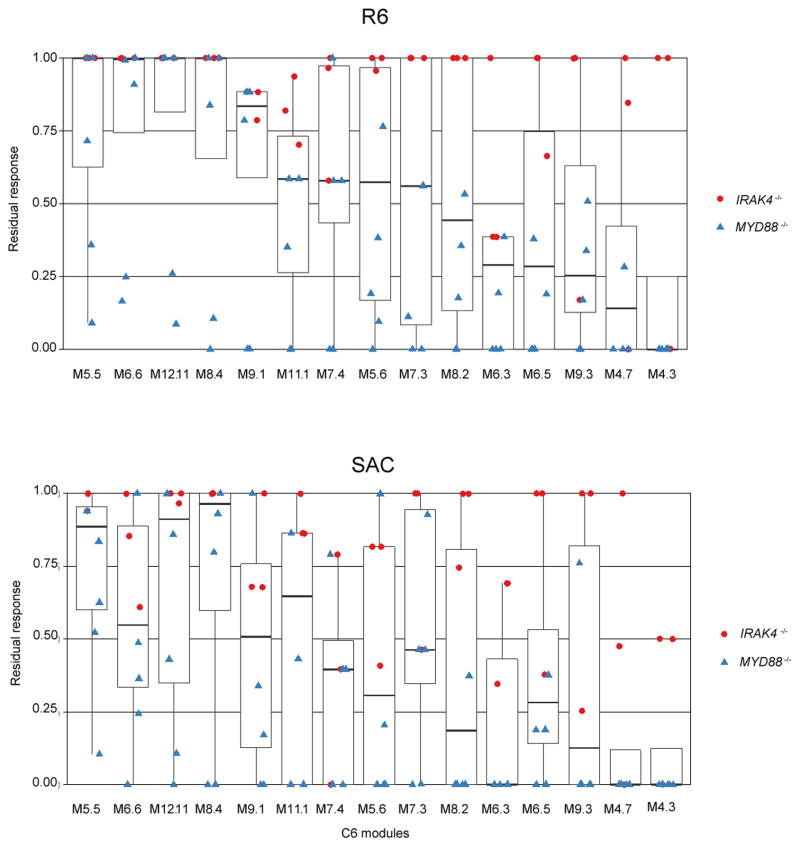
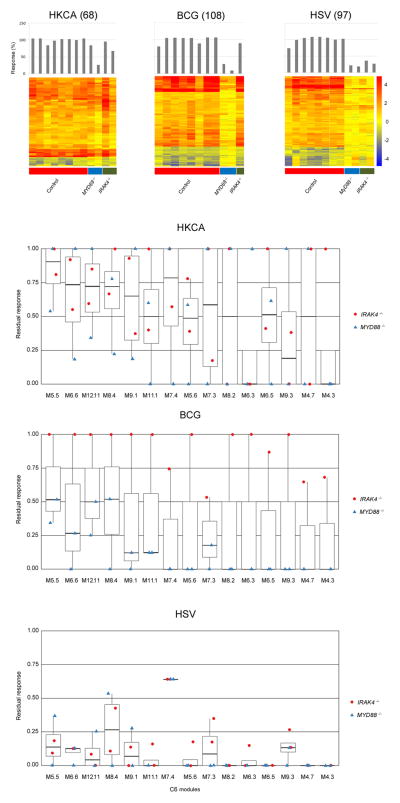
Loss of function of the kinase IRAK4 or the adaptor MyD88 in humans interrupts a pathway critical for pathogen sensing and ignition of inflammation. However, patients with loss-of-function mutations in the genes encoding these factors are, unexpectedly, susceptible to only a limited range of pathogens. We employed a systems approach to investigate transcriptome responses following in vitro exposure of patients' blood to agonists of Toll-like receptors (TLRs) and receptors for interleukin 1 (IL-1Rs) and to whole pathogens. Responses to purified agonists were globally abolished, but variable residual responses were present following exposure to whole pathogens. Further delineation of the latter responses identified a narrow repertoire of transcriptional programs affected by loss of MyD88 function or IRAK4 function. Our work introduces the use of a systems approach for the global assessment of innate immune responses and the characterization of human primary immunodeficiencies.


Figures

Figure 1
Figure 1
Blood transcriptional responses following in vitro exposure to purified TLR or IL-1R agonists. (a) Changes in expression levels of transcripts responsive to TIR agonists are represented on a heatmap. Blood from healthy controls or patients was stimulated in vitro for 2 hours with TLR agonists and cytokines (batch 1); responsive transcripts were arranged by rows via hierarchical clustering (1784, 500 and 237 for PMA + ionomycin, LPS and PAM2 stimulations, respectively), and individual subjects by columns from left to right: healthy controls (n=14), MYD88−/− patients (n=4), IRAK4−/− patients (n=4). Changes versus the non-stimulated condition are represented by a color scale: red = up-regulated; blue = down-regulated; yellow = no change. Bar graphs represent overall individual levels of responsiveness relative to the average of controls: the number of responsive probes in a given subject/average of differentially expressed probes in healthy controls x100. Responses to 8 additional TIR agonists and TNF are presented similarly in Supplementary Fig 2a. (b). The overall responsiveness of individual subjects along the horizontal axis relative to the average of controls is shown across all TIR ligand stimulations on a heatmap. Subjects and stimulations were grouped by hierarchical clustering.
Figure 2
Figure 2
Blood transcriptional responses following in vitro exposure to whole bacteria. (a). Responsive transcripts in controls and patients are represented on a heatmap for individual bacterial stimulations. Blood from healthy controls or patients (batch 1 and 2) was stimulated in vitro for 2 hours with three strains of heat-killed S. pneumoniae (R11470, R8450, R6) as well as S. aureus (SAC); responsive transcripts were arranged by rows via hierarchical clustering, (330, 282, 264 and 101 for R11470, R8450, R6 and SAC stimulations, respectively) and individual subjects by columns from left to right: healthy controls, MyD88-deficient patients, IRAK-4-deficient patients. Changes versus the non-stimulated condition are represented by a color scale: red = up-regulated; blue = down-regulated; yellow = no change. Bar graphs represent overall individual levels of responsiveness relative to the average of controls: the number of responsive probes in a given subject/average of differentially expressed probes in healthy controls x100. (b) The overall responsiveness of individual subjects along the horizontal axis relative to the average of controls is shown across all whole bacteria stimulations on a heatmap. Subjects and stimulations were grouped by hierarchical clustering.
Figure 3
Figure 3
Modular transcriptome repertoire of whole blood responses to TIRs agonists and Gram-positive bacteria stimulations. Whole genome transcriptional responses to TIRs agonists and whole Gram-positive bacteria (columns) measured in healthy control subjects were mapped against a modular repertoire composed of 66 sets of co-clustered transcripts (rows). Spots represent the percent of module probes that are up (red) or down (blue) regulated in a sample. The average “modular activity” of healthy control subjects is shown. Hierarchical clustering identified seven clusters (C0 to C6) of modules with related expression pattern across conditions. C0, C1, and C6 contain modules induced by both TIRs and bacteria stimulations, whereas C4 and C5 consist of modules uniquely activated by TLRs or bacteria respectively. Cluster C3 contained modules that did not show a clear pattern of induction by either TIR or bacterial stimulations.
Figure 4
Figure 4
Literature profiles of module clusters (C4, C5, C6). Accumenta Literature Lab™ was used to obtain literature abstract terms association scores for the modules in clusters C4, C5 and C6. Term associations suggest that C4 and C6 are functionally related to inflammation and that C5 is functionally related to cell signaling. Association scores values ranging from 0 to 3 are shown on the heatmaps, with 0 indicating that the term is not associated with the module (white); and 3 indicating that the term is highly associated with the module (dark green). The intensity of the color is proportional to the score. Modules and terms are ordered by hierarchical clustering based on similarities in patterns of term association.
Figure 5
Figure 5
Modular transcriptome repertoire mapping of patient residual responsiveness to TIRs agonists and whole bacteria. For visualization purposes, circular heatmaps were generated to represent the transcriptional modular activity of IRAK-4- (outer rings) and MyD88- (inner rings) deficient patients with respect to healthy controls in response to HK bacteria stimulations and TIRs agonists (batch 1 and 2). The values plotted represent residual responsiveness relative to the average of healthy subjects on a color scale ranging from −1 (saturated blue, intact module down-regulation) to +1 (saturated red, intact module up-regulation). Values close to zero are shown in white or very pale color. The cases where a value was missing are represented by a gray color. The histogram values shown on the hub are the absolute value of the average across patients of the normalized module scores (calculated above). Values shown range between 0 and 1, where cases with values >1 have an asterisk above the bar. Residual responses to 10 additional TIRs agonists and TNF are presented similarly in Supplementary Fig. 3.
Figure 6
Figure 6
Residual responsiveness following in vitro exposure to whole bacteria for C6 modules. Box plot displays residual responsiveness of individual patients relative to the average of healthy subjects following 2 hours in vitro exposure to heat-killed S. pneumoniae (R6 strain) and S. aureus (SAC). Red dots = IRAK4−/− patients; Blue triangles = MYD88−/− patients (batch 1 and 2). Modules represented here belong to cluster C6. Supplementary Fig. 4 shows residual responses to S. pneumoniae R11470 and R8450 strains.
Figure 7
Figure 7
Blood transcriptional responses following in vitro exposure to Candida, BCG and HSV. (a). Responsive transcripts in 8 controls and four patients (2 MYD88−/− and 2 IRAK4−/−) are represented on a heatmap for individual pathogen stimulations. Blood from healthy controls and patients (batch 3) was stimulated in vitro for 2 hours with heat-killed Candida albicans (HKCA), Bacillus Calmette-Guérin (BCG) and herpes simplex virus (HSV); responsive transcripts were arranged by rows via hierarchical clustering, (68, 108 and 97 for HKCA, BCG and HSV stimulations, respectively) and individual subjects by columns from left to right: healthy controls, MyD88-deficient patients, IRAK-4-deficient patients. Changes versus the non-stimulated condition are represented by a color scale: red = upregulated; blue = downregulated; yellow = no change. Bar graphs represent overall individual levels of responsiveness relative to the average of controls: the number of responsive probes in a given subject/average of differentially expressed probes in healthy controls x100. (b) Box plot displays residual responsiveness of individual patients (2IRAK4−/− and 2 MYD88−/−) relative to the average of healthy subjects following 2 hours in vitro exposure to HKCA, BCG and HSV. Red dots = IRAK4−/− patients; Blue triangles = MYD88−/− patients. Modules represented in the figure belong to the cluster C6.

Comment in

References

    1. Picard C, et al. Pyogenic bacterial infections in humans with IRAK-4 deficiency. Science. 2003;299:2076–2079. - PubMed
    1. von Bernuth H, et al. Pyogenic bacterial infections in humans with MyD88 deficiency. Science. 2008;321:691–696. - PMC - PubMed
    1. Akira S, Uematsu S, Takeuchi O. Pathogen recognition and innate immunity. Cell. 2006;124:783–801. - PubMed
    1. Kawai T, Akira S. The role of pattern-recognition receptors in innate immunity: update on Toll-like receptors. Nat Immunol. 2010;11:373–384. - PubMed
    1. Lee CC, Avalos AM, Ploegh HL. Accessory molecules for Toll-like receptors and their function. Nat Rev Immunol. 12:168–179. - PMC - PubMed

Publication types

MeSH terms

Substances

Supplementary concepts

Associated data