

Subcellular metal imaging identifies dynamic sites of Cu accumulation in Chlamydomonas
- PMID: 25344811
- PMCID: PMC4232477
- DOI: 10.1038/nchembio.1662
Subcellular metal imaging identifies dynamic sites of Cu accumulation in Chlamydomonas
Erratum in
-
Subcellular metal imaging identifies dynamic sites of Cu accumulation in Chlamydomonas.Nat Chem Biol. 2015 Mar;11(3):235. doi: 10.1038/nchembio0315-235c. Nat Chem Biol. 2015. PMID: 25689337 No abstract available.
Abstract
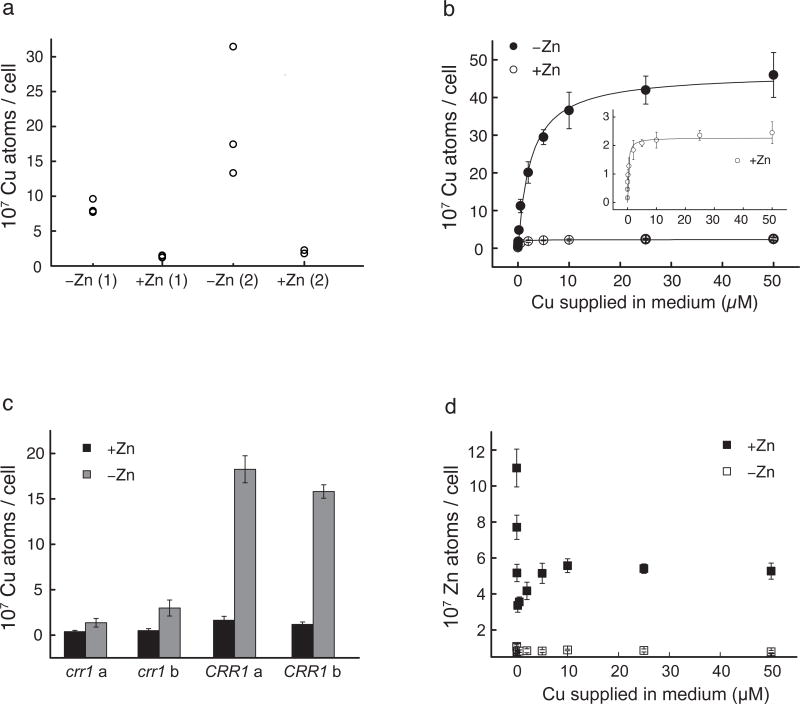
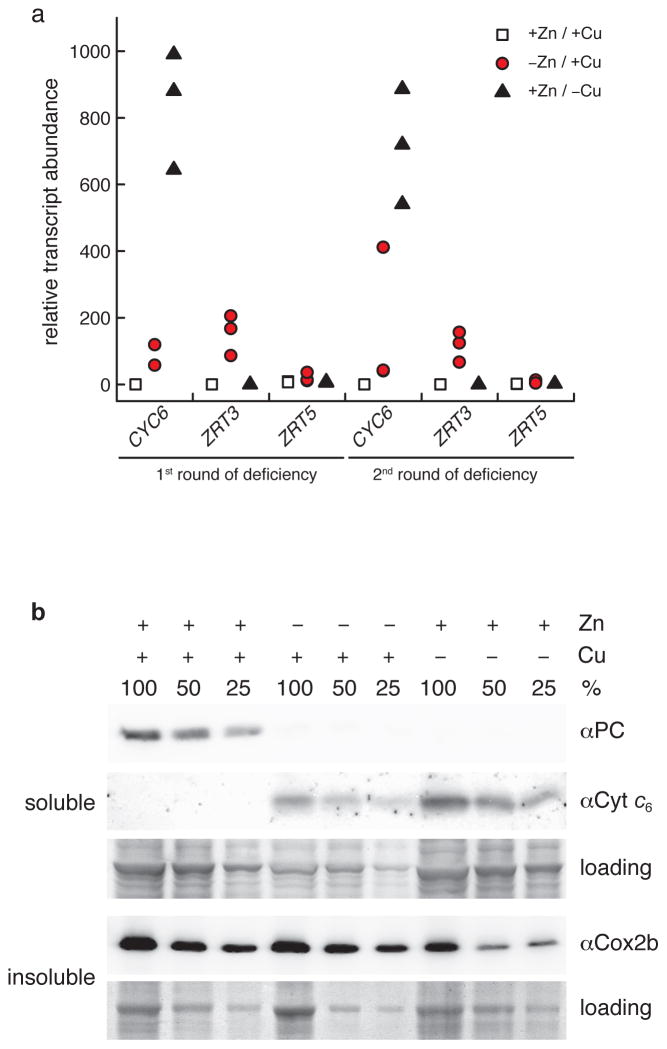
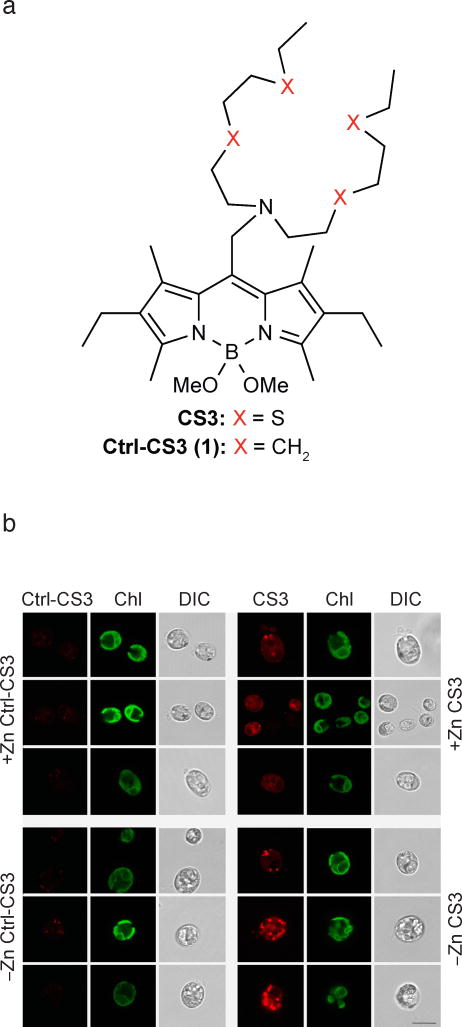
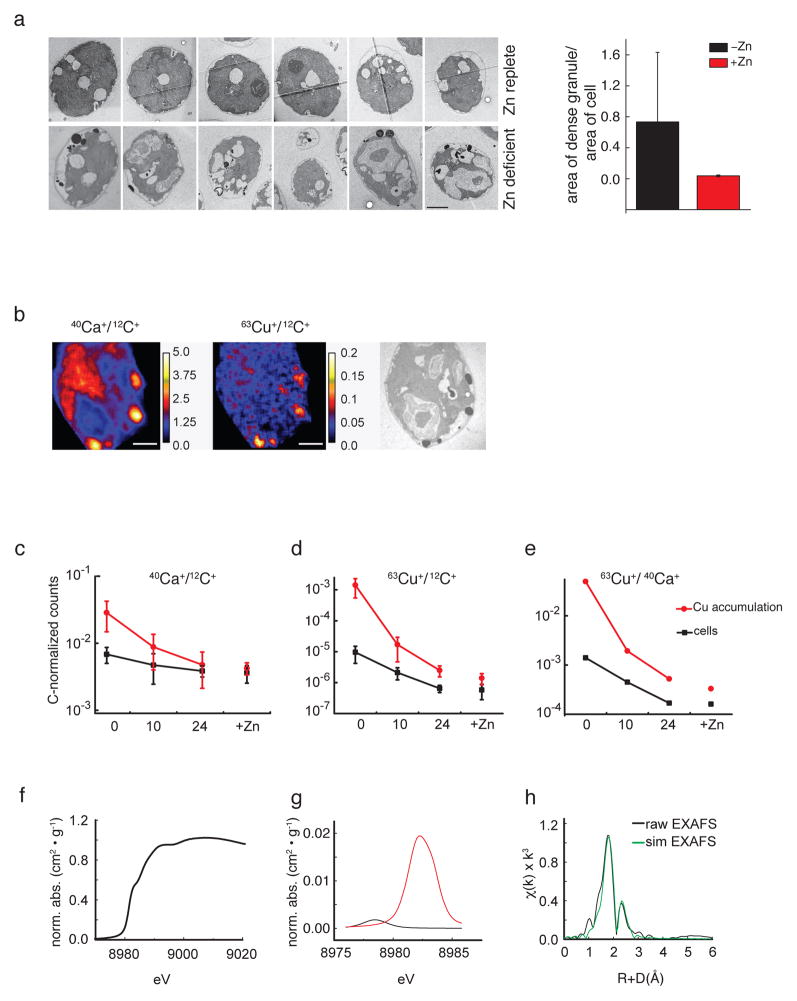
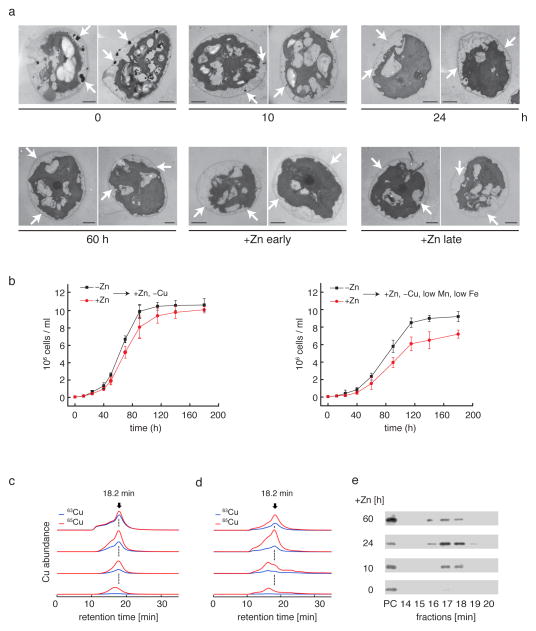
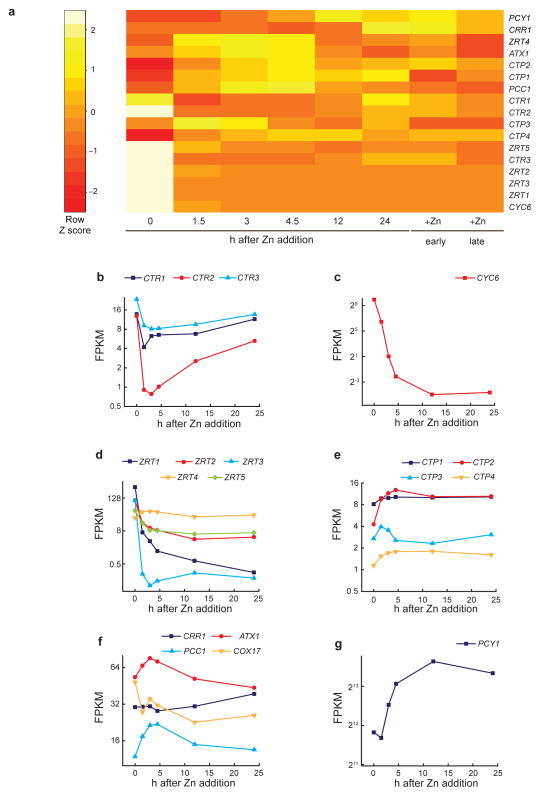
We identified a Cu-accumulating structure with a dynamic role in intracellular Cu homeostasis. During Zn limitation, Chlamydomonas reinhardtii hyperaccumulates Cu, a process dependent on the nutritional Cu sensor CRR1, but it is functionally Cu deficient. Visualization of intracellular Cu revealed major Cu accumulation sites coincident with electron-dense structures that stained positive for low pH and polyphosphate, suggesting that they are lysosome-related organelles. Nano-secondary ion MS showed colocalization of Ca and Cu, and X-ray absorption spectroscopy was consistent with Cu(+) accumulation in an ordered structure. Zn resupply restored Cu homeostasis concomitant with reduced abundance of these structures. Cu isotope labeling demonstrated that sequestered Cu(+) became bioavailable for the synthesis of plastocyanin, and transcriptome profiling indicated that mobilized Cu became visible to CRR1. Cu trafficking to intracellular accumulation sites may be a strategy for preventing protein mismetallation during Zn deficiency and enabling efficient cuproprotein metallation or remetallation upon Zn resupply.
Conflict of interest statement
Competing financial interests
The authors declare no competing financial interests.
Figures
Comment in
-
Metals: setting a trap for copper.Nat Chem Biol. 2014 Dec;10(12):986-7. doi: 10.1038/nchembio.1686. Epub 2014 Oct 26. Nat Chem Biol. 2014. PMID: 25344814 No abstract available.
Similar articles
-
Zinc deficiency impacts CO2 assimilation and disrupts copper homeostasis in Chlamydomonas reinhardtii.J Biol Chem. 2013 Apr 12;288(15):10672-83. doi: 10.1074/jbc.M113.455105. Epub 2013 Feb 25. J Biol Chem. 2013. PMID: 23439652 Free PMC article.
-
The CRR1 nutritional copper sensor in Chlamydomonas contains two distinct metal-responsive domains.Plant Cell. 2010 Dec;22(12):4098-113. doi: 10.1105/tpc.110.080069. Epub 2010 Dec 3. Plant Cell. 2010. PMID: 21131558 Free PMC article.
-
Ni induces the CRR1-dependent regulon revealing overlap and distinction between hypoxia and Cu deficiency responses in Chlamydomonas reinhardtii.Metallomics. 2016 Jul 13;8(7):679-91. doi: 10.1039/c6mt00063k. Metallomics. 2016. PMID: 27172123 Free PMC article.
-
From economy to luxury: Copper homeostasis in Chlamydomonas and other algae.Biochim Biophys Acta Mol Cell Res. 2020 Nov;1867(11):118822. doi: 10.1016/j.bbamcr.2020.118822. Epub 2020 Aug 13. Biochim Biophys Acta Mol Cell Res. 2020. PMID: 32800924 Free PMC article. Review.
-
Between a rock and a hard place: trace element nutrition in Chlamydomonas.Biochim Biophys Acta. 2006 Jul;1763(7):578-94. doi: 10.1016/j.bbamcr.2006.04.007. Epub 2006 Apr 26. Biochim Biophys Acta. 2006. PMID: 16766055 Review.
Cited by
-
Co-expression networks in Chlamydomonas reveal significant rhythmicity in batch cultures and empower gene function discovery.Plant Cell. 2021 May 31;33(4):1058-1082. doi: 10.1093/plcell/koab042. Plant Cell. 2021. PMID: 33793846 Free PMC article.
-
Flow cytometric analysis of hepatopancreatic cells from Armadillidium vulgare highlights terrestrial isopods as efficient environmental bioindicators in ex vivo settings.Environ Sci Pollut Res Int. 2024 Feb;31(6):9745-9763. doi: 10.1007/s11356-023-31375-x. Epub 2024 Jan 9. Environ Sci Pollut Res Int. 2024. PMID: 38194171 Free PMC article.
-
Temporal aspects of copper homeostasis and its crosstalk with hormones.Front Plant Sci. 2015 Apr 17;6:255. doi: 10.3389/fpls.2015.00255. eCollection 2015. Front Plant Sci. 2015. PMID: 25941529 Free PMC article. Review.
-
Emergence of metal selectivity and promiscuity in metalloenzymes.J Biol Inorg Chem. 2019 Jun;24(4):517-531. doi: 10.1007/s00775-019-01667-0. Epub 2019 May 21. J Biol Inorg Chem. 2019. PMID: 31115763 Review.
-
Optimizing Fe Nutrition for Algal Growth.Methods Mol Biol. 2023;2665:203-215. doi: 10.1007/978-1-0716-3183-6_16. Methods Mol Biol. 2023. PMID: 37166603
References
-
- Andreini C, Bertini I, Cavallaro G, Holliday GL, Thornton JM. Metal ions in biological catalysis: from enzyme databases to general principles. J Biol Inorg Chem. 2008;13:1205–18. - PubMed
-
- Irving H, Williams RJP. The stability of transition-metal complexes. J Chem Soc. 1953;637:3192–3210.
-
- Dudev T, Lim C. Metal binding affinity and selectivity in metalloproteins: insights from computational studies. Annu Rev Biophys. 2008;37:97–116. - PubMed
-
- Waldron KJ, Rutherford JC, Ford D, Robinson NJ. Metalloproteins and metal sensing. Nature. 2009;460:823–30. - PubMed
-
- Rae TD, Schmidt PJ, Pufahl RA, Culotta VC, O’Halloran TV. Undetectable intracellular free copper: the requirement of a copper chaperone for superoxide dismutase. Science. 1999;284:805–8. - PubMed
Publication types
MeSH terms
Substances
Associated data
- Actions
Grants and funding
LinkOut - more resources
Full Text Sources
Other Literature Sources
Molecular Biology Databases
