. 2015 Aug;16(6):623-32.
doi: 10.1111/mpp.12214. Epub 2014 Dec 15.

Genotype-by-sequencing of the plant-pathogenic fungi Pyrenophora teres and Sphaerulina musiva utilizing Ion Torrent sequence technology

Affiliations

Genotype-by-sequencing of the plant-pathogenic fungi Pyrenophora teres and Sphaerulina musiva utilizing Ion Torrent sequence technology

Jared M Leboldus et al. Mol Plant Pathol. 2015 Aug.

Abstract

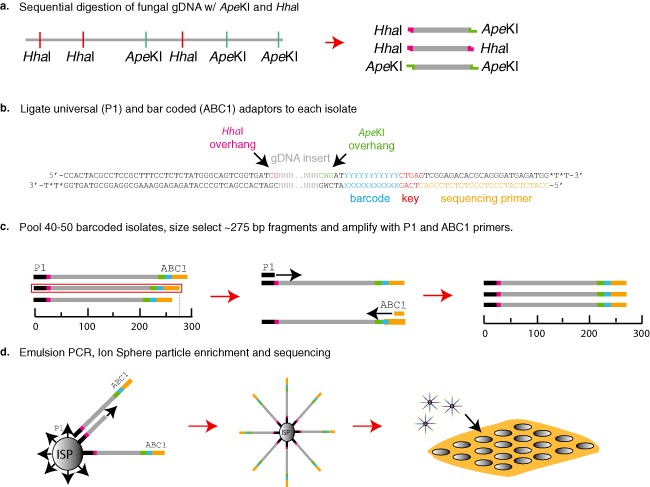
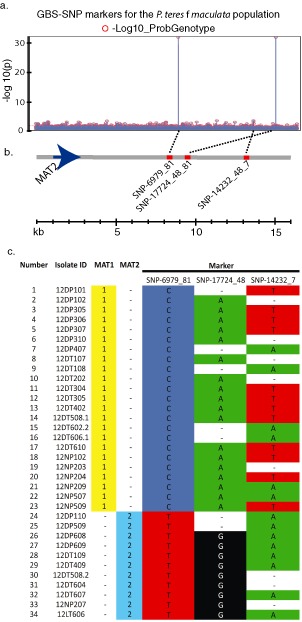
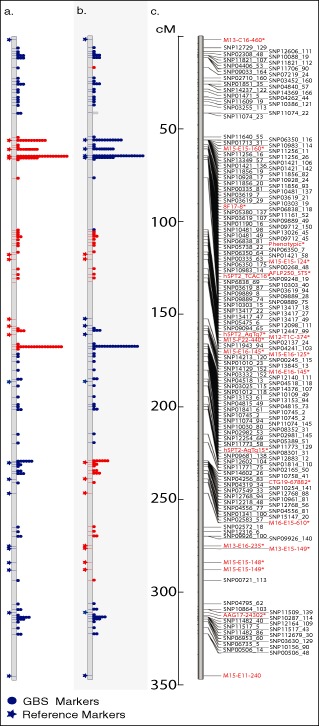
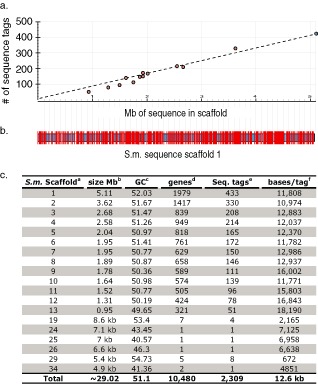
Genetic and genomics tools to characterize host-pathogen interactions are disproportionately directed to the host because of the focus on resistance. However, understanding the genetics of pathogen virulence is equally important and has been limited by the high cost of de novo genotyping of species with limited marker data. Non-resource-prohibitive methods that overcome the limitation of genotyping are now available through genotype-by-sequencing (GBS). The use of a two-enzyme restriction-associated DNA (RAD)-GBS method adapted for Ion Torrent sequencing technology provided robust and reproducible high-density genotyping of several fungal species. A total of 5783 and 2373 unique loci, 'sequence tags', containing 16,441 and 9992 single nucleotide polymorphisms (SNPs) were identified and characterized from natural populations of Pyrenophora teres f. maculata and Sphaerulina musiva, respectively. The data generated from the P. teres f. maculata natural population were used in association mapping analysis to map the mating-type gene to high resolution. To further validate the methodology, a biparental population of P. teres f. teres, previously used to develop a genetic map utilizing simple sequence repeat (SSR) and amplified fragment length polymorphism (AFLP) markers, was re-analysed using the SNP markers generated from this protocol. A robust genetic map containing 1393 SNPs on 997 sequence tags spread across 15 linkage groups with anchored reference markers was generated from the P. teres f. teres biparental population. The robust high-density markers generated using this protocol will allow positional cloning in biparental fungal populations, association mapping of natural fungal populations and population genetics studies.

Keywords: Pyrenophora teres; Sphaerulina musiva; fungi; genotype-by-sequencing.


Figures

Figure 1
Figure 1
Genotype‐by‐sequencing (GBS) protocol for fungal genomes. (a) Fungal genomic DNA was sequentially digested with the restriction enzymes HhaI then ApeKI, producing three different combinations of restriction termini. (b) The ABC1 adaptor containing the sequencing primer site (orange), Ion Torrent key site (red), barcodes (blue) and ApeKI sticky ends (green), and the P1 adaptor containing the Ion Sphere Particle attachment nucleotides (black) and HhaI sticky ends (pink), were ligated to the restriction‐digested genomic DNA fragment. (c) The barcoded fragments were pooled, unligated adaptors were removed and fragments were size selected for ∼275‐bp fragments. The 275‐bp fraction from the pooled libraries was amplified using the Ion Torrent sequencing primers and Ion Sphere Particle (ISP) primer, without sphere particles attached. (d) The polymerase chain reaction (PCR) products were quantified and emulsion PCR was performed to add monoclonal DNA templates to a single ISP. The ISPs with DNA templates were enriched on the Ion One Touch 2 bead enrichment station and loaded into single wells on the 318 chip and sequenced on the Ion Torrent PGM™.
Figure 2
Figure 2
Graph showing the distribution of sequence tags and percentage of data points present for each isolate. Bars and dots above correspond to a single isolate, and red indicates Pyrenophora teres f. maculata (Ptm) sequences, orange P. teres f. teres (Ptt) and yellow Sphaerulina musiva (Sm). The left axis scale is the number of reads corresponding to the bar chart, ranging from 34 316 to 432 627 sequence reads. The right axis scale is the percentage of data present corresponding to the dots. The asterisks next to the four dots indicate P. teres f. teres isolates that were originally isolated from the natural P. teres f. maculata collections in North Dakota. The line indicates the mean change in percentage data present with increased sequence reads per isolate.
Figure 3
Figure 3
Data validating the polymerase chain reaction‐genotype‐by‐sequencing (PCR‐GBS) data for association mapping of the mating type gene in the Pyrenophora teres f. maculata natural population. (a) Manhattan plot showing significant marker trait associations (MTAs) between the 16 441 GBS‐single nucleotide polymorphisms (GBS‐SNPs) and the mating type trait using a general linearized model approach in JMP Genomics. (b) The physical sequence at the mating type locus showing significant MTAs in relation to the mating type 2 gene (MAT2). The grey horizontal line represents the sequence from the mating type locus of P. teres f. teres with the blue arrow depicting the MAT2 gene and the red bars showing the relative position of the significant SNP markers. The broken black lines show where the MTAs for the specific markers are located on the Manhattan plot above. (c) A graph showing the correlation of the genotypes of all 24 isolates for mating type and significant markers. Mating type and SNP markers are perfectly correlated for markers SNP‐06979_81 and SNP‐17724_48.
Figure 4
Figure 4
Linkage group 1 from the genetic map developed using the biparental population created from the cross between Pyrenophora teres f. teres isolates 15A and 0–1. (a, b) Individual progeny lines with genotype indicated by colour: red is 15A and blue is 0–1. The stars to the left of the vertical grey bar indicate the genetic position and genotype of anchored simple sequence repeat (SSR) and amplified fragment length polymorphism (AFLP) markers. The dots to the right of the vertical bars indicate the position and number of restriction‐associated DNA‐genotype‐by‐sequencing (RAD‐GBS) single nucleotide polymorphism (SNP) markers positioned from the data generated with the protocol described here. A transition in colour indicates the region delimiting a recombination event in the specific progeny line. (c) Genetic map containing the GBS SNP markers with SNP markers in black and anchored SSR and AFLP markers in red. The scale corresponding to all three maps is in centimorgans (cM).
Figure 5
Figure 5
Alignment of 434 genotype‐by‐sequencing (GBS) single nucleotide polymorphism (SNP) markers to the JGISeptoria musiva (Scaffold 1; ∼5.1 Mb) sequence assembly. (a) The graph shows the distribution of all 2309 sequence tags containing informative SNPs across the 13 largest S. musiva scaffolds ranging from 0.95 to 5.1 Mb. The x‐axis is the Mb of sequence in the sequence scaffold and the y‐axis is the number of sequence tags containing informative SNPs. The dots represent the 13 major scaffolds in the S. musiva genome assembly. The blue dot represents the largest (5.1 Mb) scaffold used for analysis in Fig. 1b. (b) The horizontal blue/black bordered bar represents the 5.1‐Mb S. musiva genome Scaffold 1 sequence from the JGI database (http://genome.jgi‐psf.org/Sepmu1/Sepmu1.info.html). The vertical white lines show the position of missing sequence between contigs within the scaffold. The red vertical lines show the positions of the 433 GBS ‘sequence tags’ containing informative SNPs. (c) Table showing the alignment of GBS sequence tags containing SNPs to the S. musiva genome sequence. aScaffold numbers from the JGI website (http://genome.jgi‐psf.org/Sepmu1/Sepmu1.info.html). bSize of sequence scaffolds given in megabases unless designated by kb (kilobases). c GC content of designated sequence scaffolds. dNumber of predicted genes present on sequence scaffold. eNumber of sequence tags aligning to scaffold. fNumber of nucleotide bases per sequence tag marker.

References

    1. Antequera, F. , Tamame, M. , Villanueva, J.R. and Santos, T. (1984) DNA methylation in the fungi. J. Biol. Chem. 259, 8033–8036. - PubMed
    1. Arumuganathan, K. and Earle, E. (1991) Nuclear DNA content of some important plant species. Plant Mol. Biol. Rep. 9, 208–218.
    1. Baird, N.A. , Etter, P.D. , Atwood, T.S. , Currey, M.C. , Shiver, A.L. , Lewis, Z.A. , Selker, E.U. , Cresko, W.A. and Johnson, E.A. (2008) Rapid SNP discovery and genetic mapping using sequenced RAD markers. PLoS ONE, 3, e3376. - PMC - PubMed
    1. Baxter, S.W. , Davey, J.W. , Johnston, J.S. , Shelton, A.M. , Heckel, D.G. , Jiggins, C.D. and Blaxter, M.L. (2011) Linkage mapping and comparative genomics using next‐generation RAD sequencing of a non‐model organism. PLoS ONE, 6, e19315. - PMC - PubMed
    1. Binz, T. , D'Mello, N. and Horgen, P.A. (1998) A comparison of DNA methylation levels in selected isolates of higher fungi. Mycologia, 90, 785–790.

Publication types

LinkOut - more resources