. 2015 Feb;33(2):589-600.
doi: 10.1002/stem.1874.

Engineering toxin-resistant therapeutic stem cells to treat brain tumors

Affiliations

Engineering toxin-resistant therapeutic stem cells to treat brain tumors

Daniel W Stuckey et al. Stem Cells. 2015 Feb.

Abstract

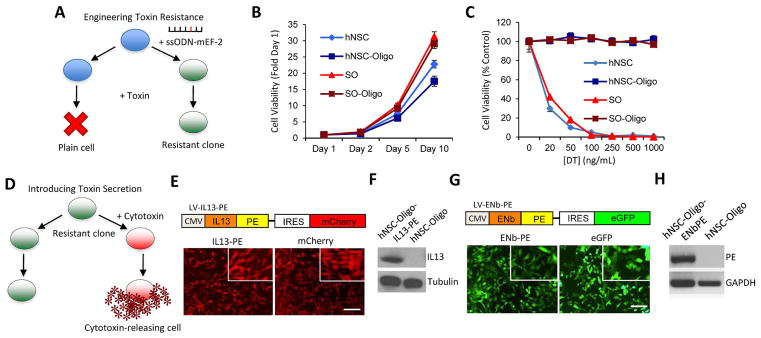
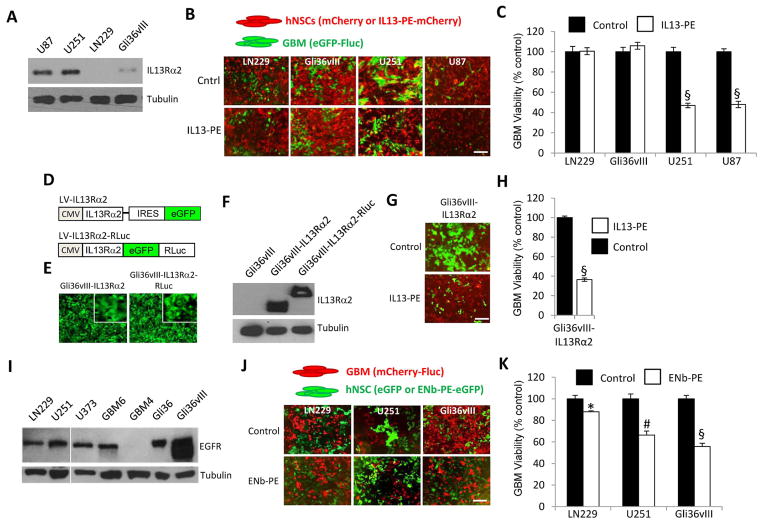
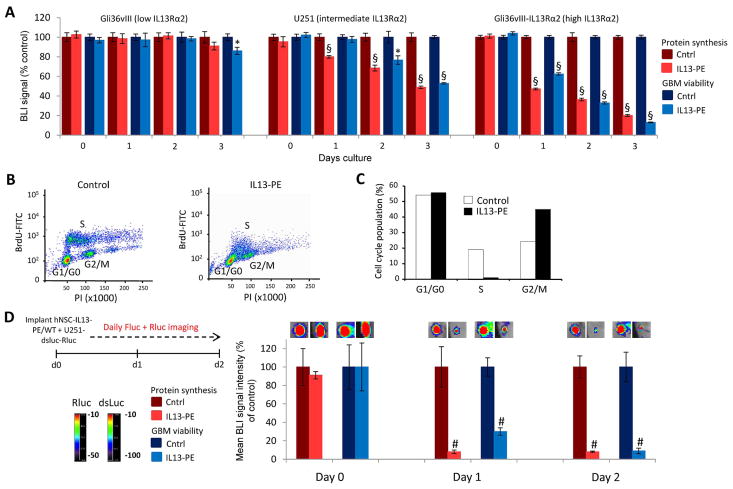
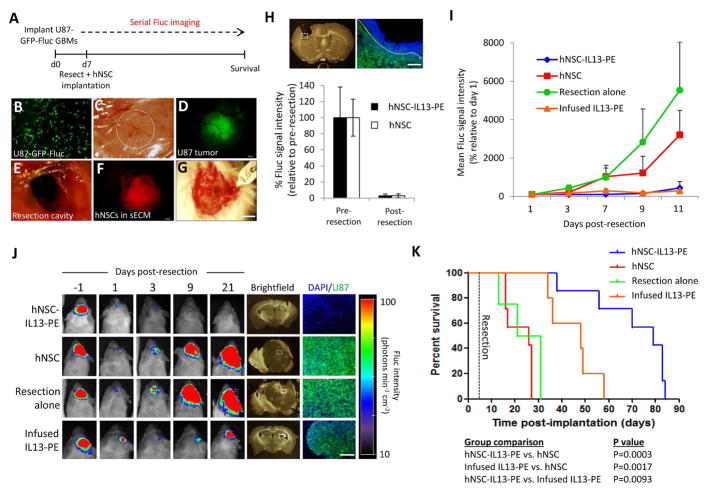
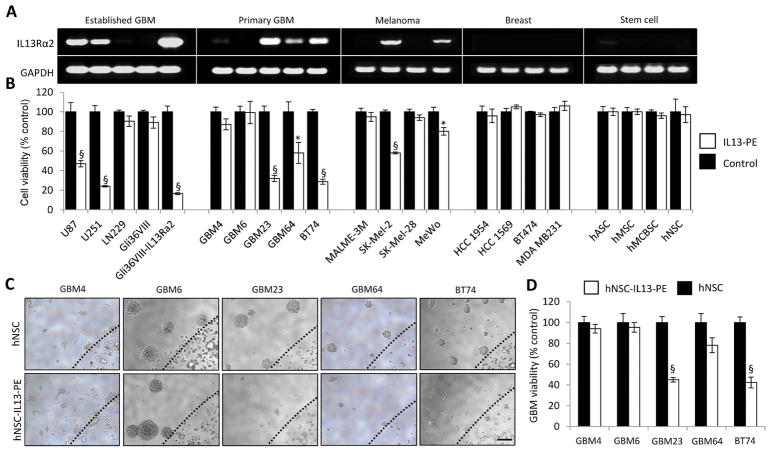
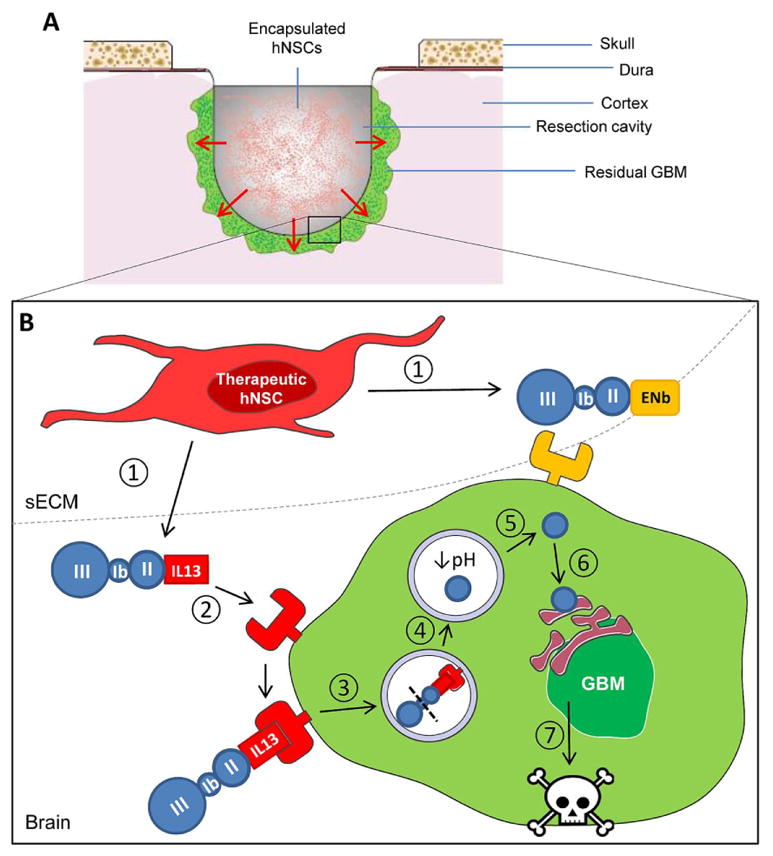
Pseudomonas exotoxin (PE) potently blocks protein synthesis by catalyzing the inactivation of elongation factor-2 (EF-2). Targeted PE-cytotoxins have been used as antitumor agents, although their effective clinical translation in solid tumors has been confounded by off-target delivery, systemic toxicity, and short chemotherapeutic half-life. To overcome these limitations, we have created toxin-resistant stem cells by modifying endogenous EF-2, and engineered them to secrete PE-cytotoxins that target specifically expressed (interleukin-13 receptor subunit alpha-2) or overexpressed (epidermal growth factor receptor) in glioblastomas (GBM). Molecular analysis correlated efficacy of PE-targeted cytotoxins with levels of cognate receptor expression, and optical imaging was applied to simultaneously track the kinetics of protein synthesis inhibition and GBM cell viability in vivo. The release of IL13-PE from biodegradable synthetic extracellular matrix (sECM) encapsulated stem cells in a clinically relevant GBM resection model led to increased long-term survival of mice compared to IL13-PE protein infusion. Moreover, multiple patient-derived GBM lines responded to treatment, underscoring its clinical relevance. In sum, integrating stem cell-based engineering, multimodal imaging, and delivery of PE-cytotoxins in a clinically relevant GBM model represents a novel strategy and a potential advancement in GBM therapy.

Keywords: Cytotoxin; Glioblastoma; Molecular imaging; Stem cell; Targeted therapy.


Conflict of interest statement

DISCLOSURE OF POTENTIAL CONFLICTS OF INTEREST

The authors declare no potential conflicts of interest.

Figures

Fig. 1
Fig. 1. Engineering toxin-resistant stem cells that secrete PE-cytotoxins
(A) Schematic representation of the approach used to make cells resistant to PE-immunotoxins. Wild-type cells (blue) were transfected with ssODN-mEF-2 to introduce a mutation in the endogenous EF-2 gene. Cells were cultured in toxin-containing medium, and single resistant clones were selected and expanded. (B) Summary data showing the growth rates of SO, hNSC, SO-Oligo, and hNSC-Oligo cells at day 1, 2, 5 and 10 days. (C) Summary graph demonstrating the viability of SO, hNSC, SO-Oligo, and hNSC-Oligo cells treated with DT at increasing concentrations (0–1000 ng/mL). (D) Schematic representation of the approach for introducing cytotoxins into toxin-resistant cells. Resistant clones (green) were transfected with a vector encoding IL13-PE cloned upstream of a fluorescence marker and puromycin selection cassette. Cells were cultured in the presence of puromycin (1 μg/mL) and positive clones (red) were selected, expanded and characterized. (E) Toxin resistant hNSC-Oligo cells were engineered to stably express IL13-PE-mCherry or mCherry alone. Fluorescence images showing mCherry expression in both hNSC lines (inset x10 magnification). (F) Western blot analysis demonstrating IL13-PE protein expression in the lysates of hNSC-Oligo cells stably expressing IL13-PE. (G) Toxin resistant hNSC-Oligo cells were engineered to stably express ENb-PE-eGFP or eGFP alone. Fluorescence images showing eGFP expression in both hNSC lines (inset x10 magnification). (H) RT-PCR demonstrating the presence of PE transcript expression in hNSC-ENb-PE cells versus an absence in unmodified hNSC cells. Scale bars, 100 μm. Data are expressed as mean ± s.e.m. Scale bars, 100 μm.
Fig. 2
Fig. 2. Stem cell-delivered PE-cytotoxins reduce cell viability of GBMs
(A) Western blot analysis of IL13Rα2 expression from the lysates of established human GBM lines. (B) Representative fluorescence images from final day of co-culture. GBM cells (green) and hNSCs (red). (C) Cell viability of human GBM cells expressing eGFP-Fluc, co-cultured with hNSC-IL13-PE-mCherry or hNSC-mCherry. (D) Lentiviral vectors were constructed consisting of IL13Rα2 cloned upstream of IRES-eGFP or as a direct fusion to eGFP-RLuc. (E) Representative fluorescence images (inset x10 magnification) and (F) Western blot analysis revealing the expression of IL13Rα2 and IL13Rα2-eGFP-RLuc in unmodified and LV-tranduced Gli36vIII cells. (G) Representative fluorescence images from final day of co-culture. Gli36vIII-IL13Rα2 cells (green) and hNSCs (red). (H) Cell viability of Gli36vIII-IL13Rα2 GBM cells expressing eGFP-Fluc, co-cultured with hNSC-IL13-PE-mCherry or hNSC-mCherry. (I) Western blot analysis of EGFR expression from the lysates of established human GBM lines. (J) Representative fluorescence images from final day of co-culture. GBM cells (red) and hNSCs (green). (K) Cell viability of human GBM cells expressing mCherry-Fluc, co-cultured with hNSC-ENb-PE-eGFP or hNSC-eGFP. Scale bars, 100 μm. Data are expressed as mean ± s.e.m. Significance of unpaired t test, * P < 0.05; # P <0.01; § P < 0.001; treated versus control for each GBM line.
Fig. 3
Fig. 3. IL13-PE decreases GBM viability by blocking protein synthesis and inducing cell cycle arrest
(A) Plot of cell viability and protein synthesis in three GBM lines treated with IL13-PE or control conditioned medium and followed daily by simultaneous Fluc and Rluc imaging. (B) Scatter plots and summary data (C) of cell cycle analysis performed on U251 GBM cells treated with IL13-PE or control conditioned media. Data are expressed as percentage of total cell population in G1, S, or G2-M. (D) U251 GBM cells were engineered to co-express the protein synthesis marker, dsluc, and cell viability marker Rluc. These cells were mixed with either hNSC-Oligo-IL13-PE or unmodified hNSC cells and implanted subcutaneously in SCID mice. Bioluminescence imaging was performed daily to assess protein synthesis and GBM viability. Representative visible light plus superimposed bioluminescence images of tumors are shown (color scale units, photons min−1 cm−2; here and in subsequent figures) and quantified. Data are expressed as mean ± s.e.m. Significance of unpaired t test, * P < 0.05; # P <0.01; § P < 0.001; treated versus control for each GBM line.
Fig. 4
Fig. 4. Stem cell-delivered IL13-PE kills residual tumor and prolongs survival of mice in a GBM resection cavity
(A) Schematic showing how the resection experiment was performed. (B) U87 GBM cells were transduced with LV-Fluc-eGFP and imaged 48 hours later for eGFP expression. (C) A cranial window was established in mice and 2 x 10⁵ U87-Fluc-eGFP cells/mouse were superficially implanted through the cranial window. Dashed circle demarcates the established tumor in the cranial window. (D) Fluorescence photomicrograph showing an established U87-Fluc-eGFP GBM (green) in the cranial window. (E) Light image of cranial window following tumor resection. (F) Fluorescence photomicrograph showing hNSC-mCherry cells (red) encapsulated in sECM and placed in the tumor resection cavity. (G) Light image showing encapsulated hNSCs in tumor resection cavity. (H) Light image and fluorescent micrograph of a coronal brain section following GBM resection. U87-Fluc-eGFP (green), DAPI-stained nuclei (blue). Mean Fluc signal intensity was quantified and plotted before and following surgical resection in both stem cell groups to determine the extent of resection. (I) Plot of Fluc signal intensity before and after tumor resection in treatment groups. (J) Representative visible light plus superimposed bioluminescence images (color scale units, photons min−1 cm−2) before and at various time points following tumor resection. Four treatment groups correspond to resection alone; resection plus hNSC-mCherry in sECM; resection plus hNSC-IL13PE in sECM and resection plus infusion of IL13-PE conditioned medium (40 ng/mouse) into the resection cavity. Tumor recurrence was determined 21 days post- tumor resection in the four treatment groups, assessed histologically and by correlative fluorescence imaging of serial coronal brain sections. U87-Fluc-eGFP (green), DAPI-stained nuclei (blue). Dashed white boxes indicate region of interest. (K) Kaplan-Meier survival curves of mice bearing resected U87-Fluc-eGFP tumors in the four treatment groups. Significance of comparison groups assessed by Mantel Cox Log rank test and tabulated. Scale bars, 100 μm (B,H (right), J (far right)) and 400 μm (H (left), J (brightfield images)). Data are expressed as mean ± s.e.m.
Fig. 5
Fig. 5. IL13-PE has anti-tumor effects on primary human GBMs
(A) Semi-quantitative RT-PCR analysis of IL13Rα2 expression from a variety of cancer and stem cell lines. (B) Cell viability of these cancer and stem cell lines following treatment with 25 ng/mL IL13-PE or control conditioned medium. (C) hNSCs expressing mCherry or IL13-PE were encapsulated in sECM and co-cultured with primary human GBM cells. Representative photomicrographs of GBM neurospheres and encapsulated hNSCs. Black dashed line indicates edge of sECM. (D) Plot showing GBM cell viability following 5 days culture with encapsulated hNSCs expressing mCherry or IL13-PE. Scale bars, 100 μm. Data are expressed as mean ± s.e.m. Significance of unpaired t test, * P < 0.05; # P <0.01; § P < 0.001; treated versus control for each cell line. Scale bar, 100 μm.
Fig. 6
Fig. 6. Summary scheme outlining the action of stem cell-delivered PE-cytotoxins in the tumor resection cavity
(A) A cross section of the tumor resection cavity. Residual tumor cells (green) are depicted in the resection margins. The cavity has been filled with therapeutic hNSCs encapsulated in sECM. Secreted PE-cytotoxins pass through the sECM matrix where they can act on remaining tumor cells in the resection border. (B) An enlarged projection of the resection cavity highlighting the mechanism of action of the PE-cytotoxin strategy. 1. IL13-PE and ENb-PE cytotoxins are secreted from toxin-resistant hNSCs that are encapsulated in the resection cavity. 2. The PE-cytotoxins bind to their cognate receptor at high affinity. In this case IL13-PE is binding to IL13Rα2 expressed on the cell surface of the GBM cell. 3. Toxin-bound receptor is internalized. Domain II of PE mediates the translocation of the complex into the endosome. 4. Once in the endosome, the protease furin cleaves PE and activates catalytic domain III. 5. The low pH of the endosome compartment causes the toxin to translocate into the cytosol. 6. The catalytic domain traverses the endoplasmic reticulum and inhibits protein synthesis by binding to elongation factor-2. 7. Inhibition of protein synthesis leads to GBM cell death.

References

    1. Hwang J, Fitzgerald DJ, Adhya S, Pastan I. Functional domains of Pseudomonas exotoxin identified by deletion analysis of the gene expressed in E. coli. Cell. 1987 Jan 16;48:129. - PubMed
    1. Weldon JE, Pastan I. A guide to taming a toxin--recombinant immunotoxins constructed from Pseudomonas exotoxin A for the treatment of cancer. The FEBS journal. 2011 Dec;278:4683. - PMC - PubMed
    1. Okada H, et al. Expression of glioma-associated antigens in pediatric brain stem and non-brain stem gliomas. Journal of neuro-oncology. 2008 Jul;88:245. - PMC - PubMed
    1. Wykosky J, Gibo DM, Stanton C, Debinski W. Interleukin-13 receptor alpha 2, EphA2, and Fos-related antigen 1 as molecular denominators of high-grade astrocytomas and specific targets for combinatorial therapy. Clinical cancer research : an official journal of the American Association for Cancer Research. 2008 Jan 1;14:199. - PubMed
    1. Jarboe JS, Johnson KR, Choi Y, Lonser RR, Park JK. Expression of interleukin-13 receptor alpha2 in glioblastoma multiforme: implications for targeted therapies. Cancer research. 2007 Sep 1;67:7983. - PubMed

Publication types

MeSH terms