

Test-Retest Intervisit Variability of Functional and Structural Parameters in X-Linked Retinoschisis
- PMID: 25346871
- PMCID: PMC4187428
- DOI: 10.1167/tvst.3.5.5
Test-Retest Intervisit Variability of Functional and Structural Parameters in X-Linked Retinoschisis
Abstract
Purpose: To examine the variability of four outcome measures that could be used to address safety and efficacy in therapeutic trials with X-linked juvenile retinoschisis.
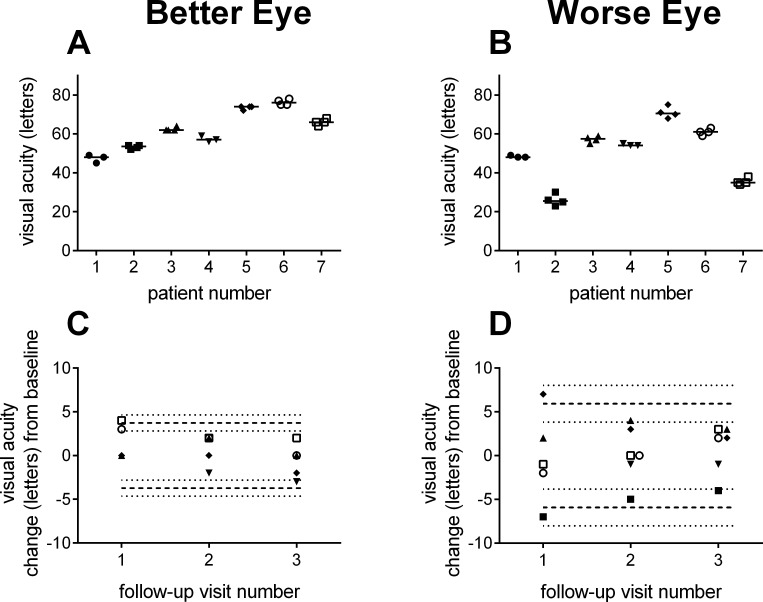
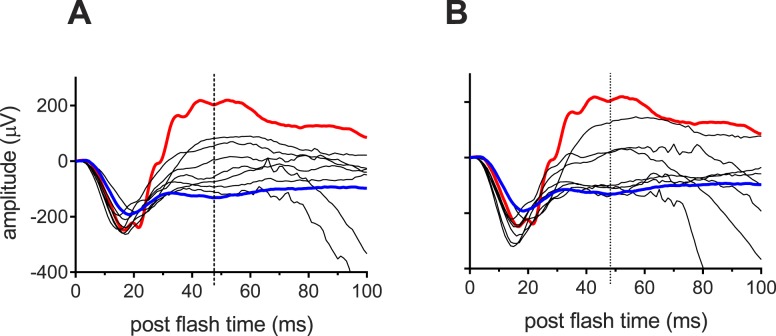
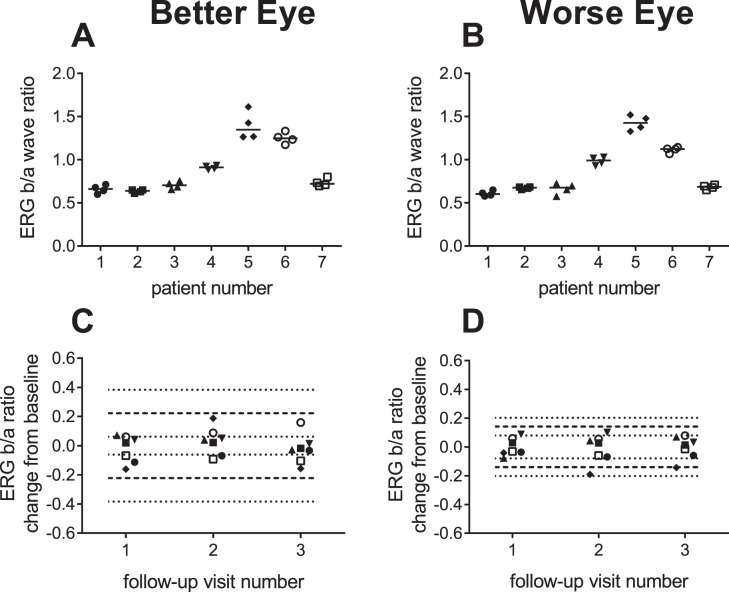
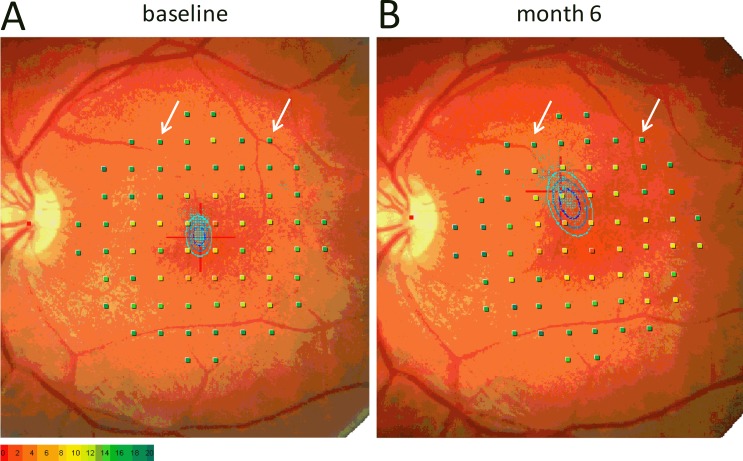
Methods: Seven men with confirmed mutations in the RS1 gene were evaluated over four visits spanning 6 months. Assessments included visual acuity, full-field electroretinograms (ERG), microperimetric macular sensitivity, and retinal thickness measured by optical coherence tomography (OCT). Eyes were separated into Better or Worse Eye groups based on acuity at baseline. Repeatability coefficients were calculated for each parameter and jackknife resampling used to derive 95% confidence intervals (CIs).
Results: The threshold for statistically significant change in visual acuity ranged from three to eight letters. For ERG a-wave, an amplitude reduction greater than 56% would be considered significant. For other parameters, variabilities were lower in the Worse Eye group, likely a result of floor effects due to collapse of the schisis pockets and/or retinal atrophy. The criteria for significant change (Better/Worse Eye) for three important parameters were: ERG b/a-wave ratio (0.44/0.23), point wise sensitivity (10.4/7.0 dB), and central retinal thickness (31%/18%).
Conclusions: The 95% CI range for visual acuity, ERG, retinal sensitivity, and central retinal thickness relative to baseline are described for this cohort of participants with X-linked juvenile retinoschisis (XLRS).
Translational relevance: A quantitative understanding of the variability of outcome measures is vital to establishing the safety and efficacy limits for therapeutic trials of XLRS patients.
Keywords: MP1; OCT; XLRS; electroretinogram; retinoschisis.
Figures
References
-
- Functional implications of the spectrum of mutations found in 234 cases with X-linked juvenile retinoschisis. The Retinoschisis Consortium. Hum Mol Genet. 1998;7:1185–1192. - PubMed
-
- Sauer CG, Gehrig A, Warneke-Wittstock R, et al. Positional cloning of the gene associated with X-linked juvenile retinoschisis. Nat Genet. 1997;17:164–170. - PubMed
-
- Sieving PA, MacDonald IM, Meltzer MR, Smaoui . Seattle, WA: University of Washington; 1993–2014. In: Pagon RA, Adam MP, Ardinger HH, et al., Eds, GeneReviews [Internet]
LinkOut - more resources
Full Text Sources
Other Literature Sources
Miscellaneous
