. 2015 Jan;16(1):75-84.
doi: 10.1038/ni.3035. Epub 2014 Oct 27.

The CLEC-2-podoplanin axis controls the contractility of fibroblastic reticular cells and lymph node microarchitecture

Affiliations

The CLEC-2-podoplanin axis controls the contractility of fibroblastic reticular cells and lymph node microarchitecture

Jillian L Astarita et al. Nat Immunol. 2015 Jan.

Abstract

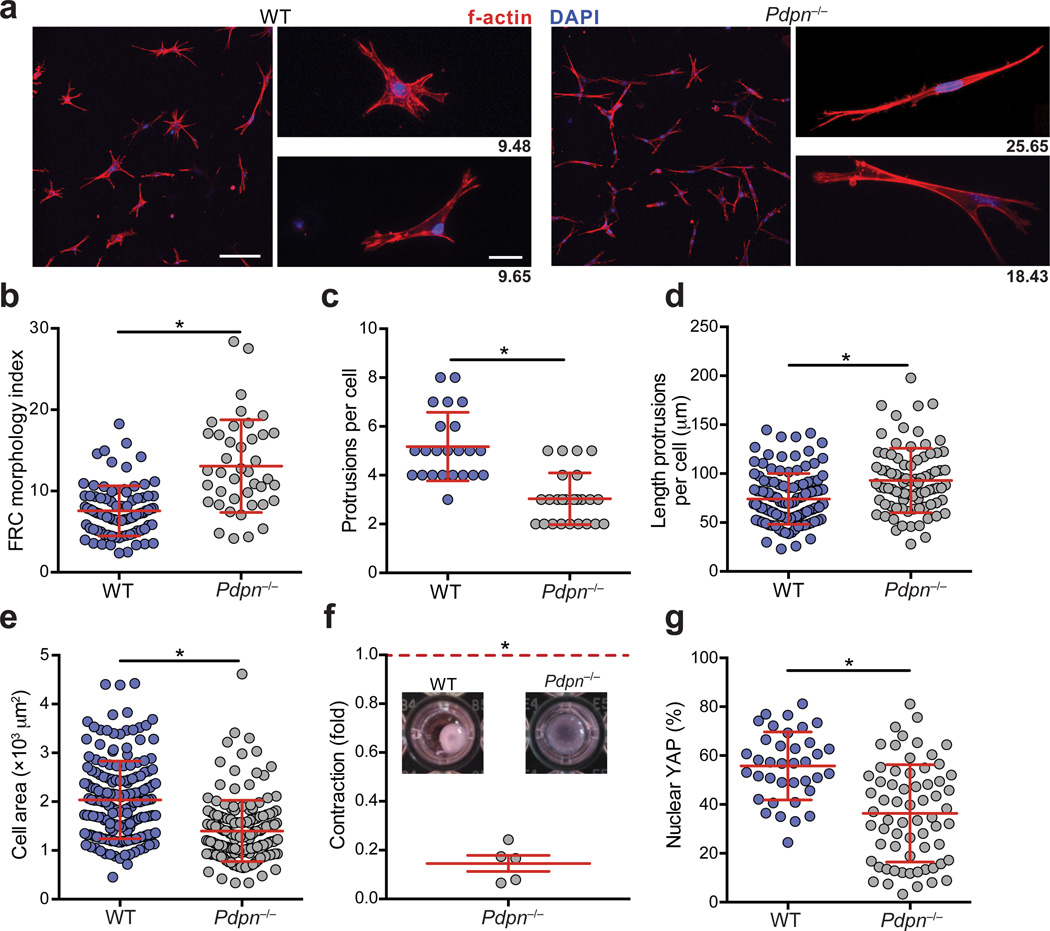
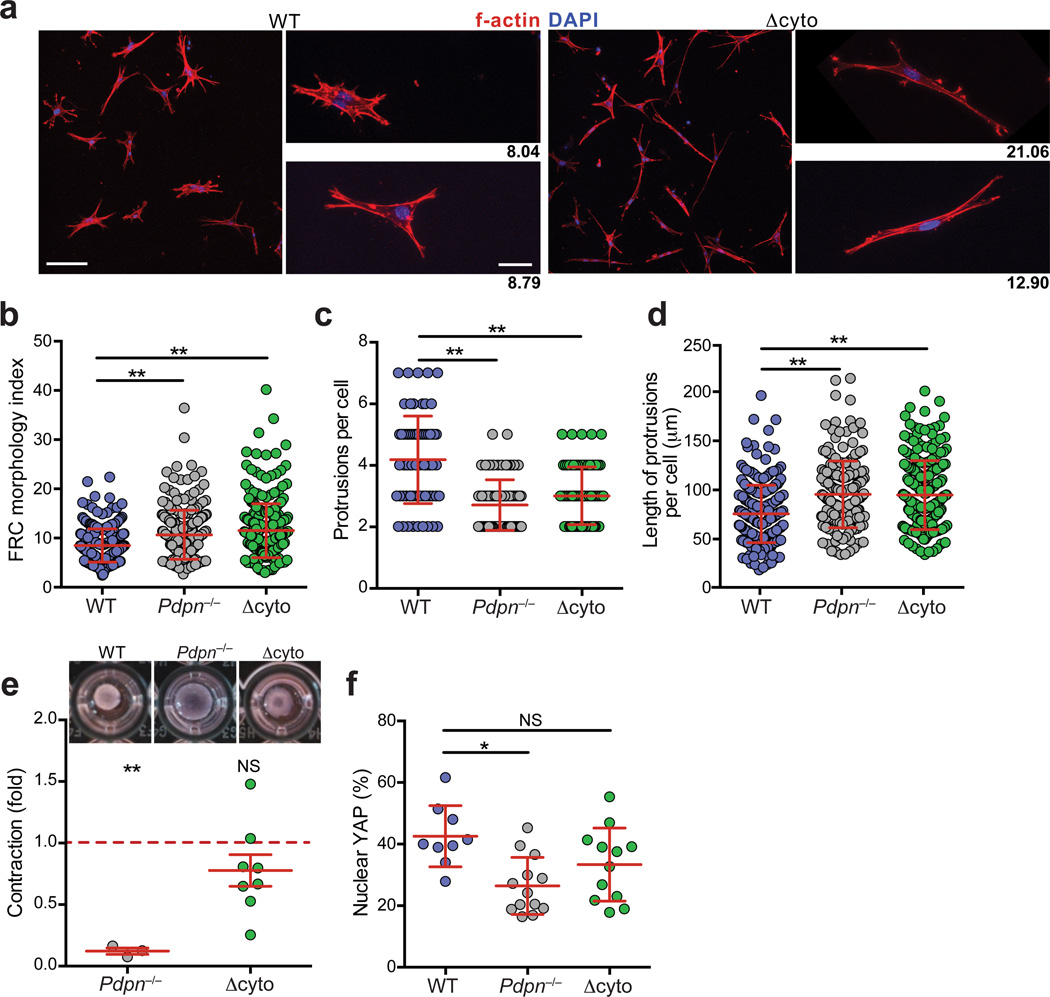
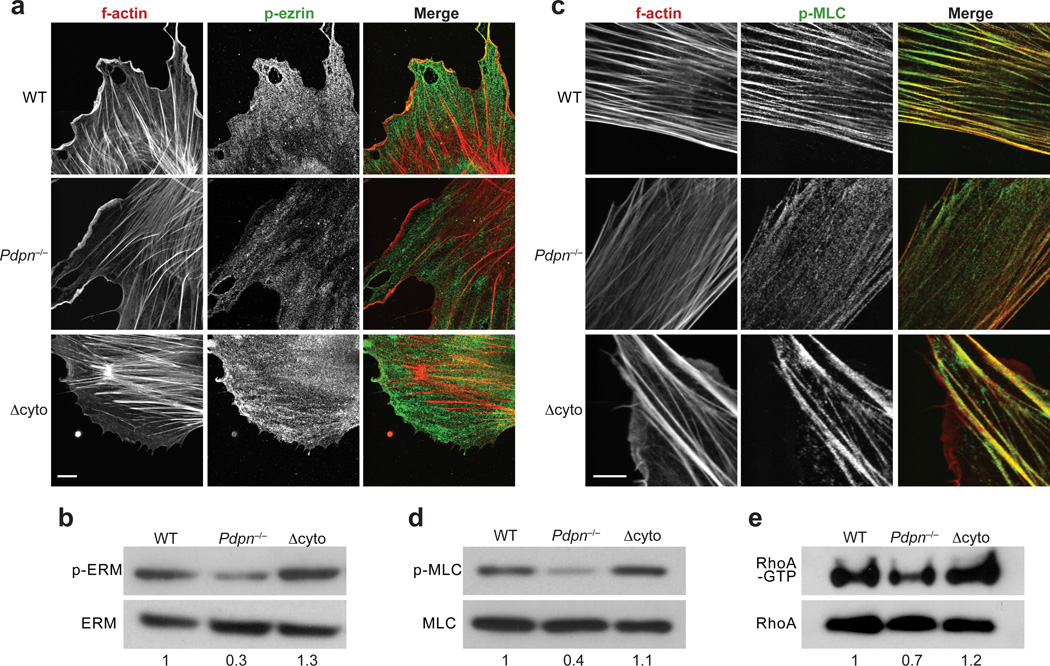
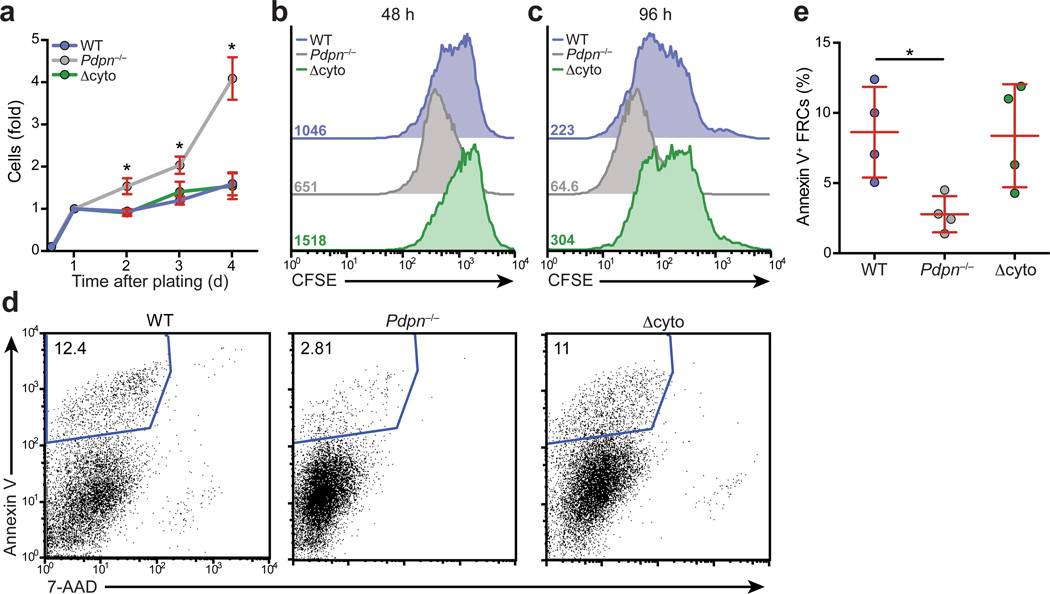
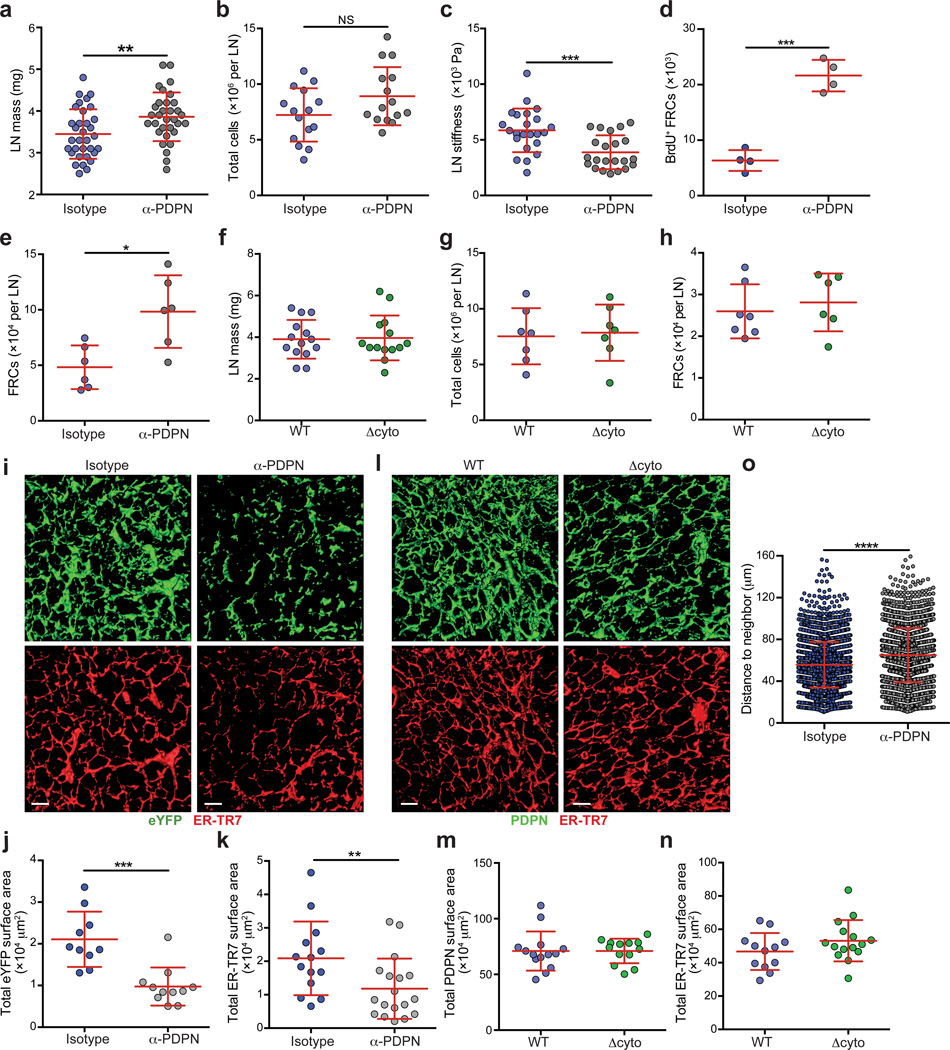
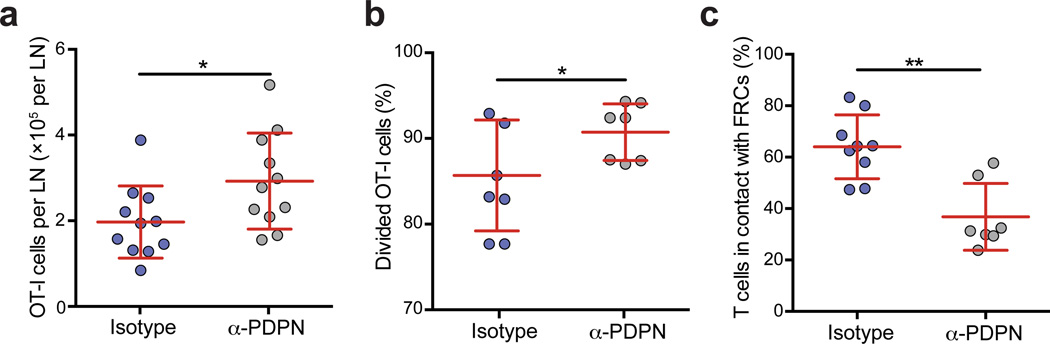
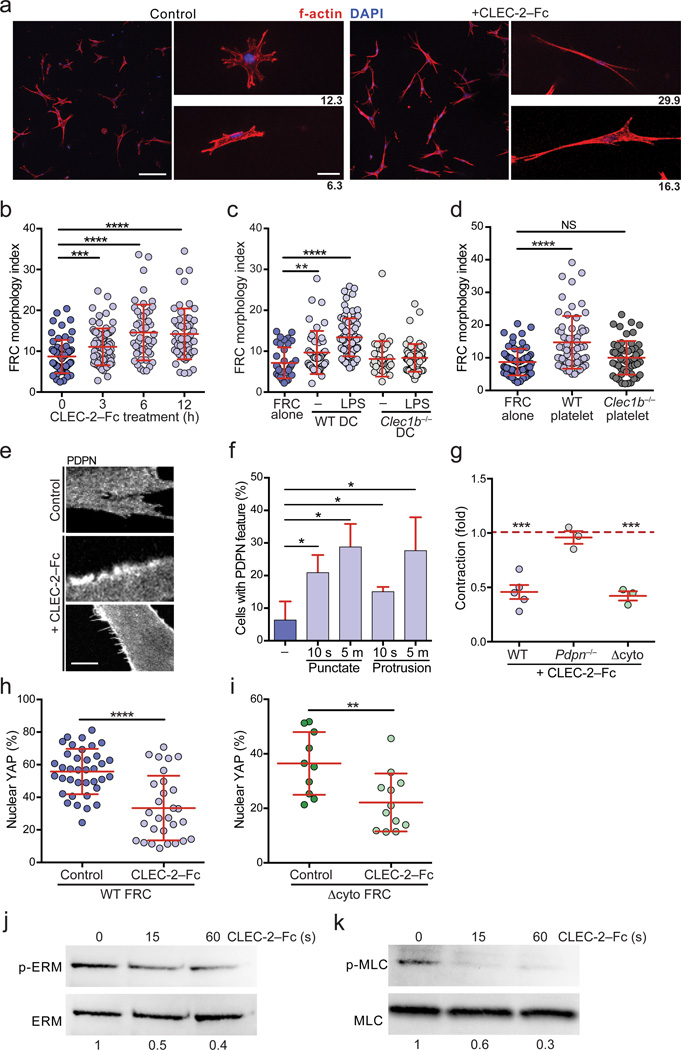
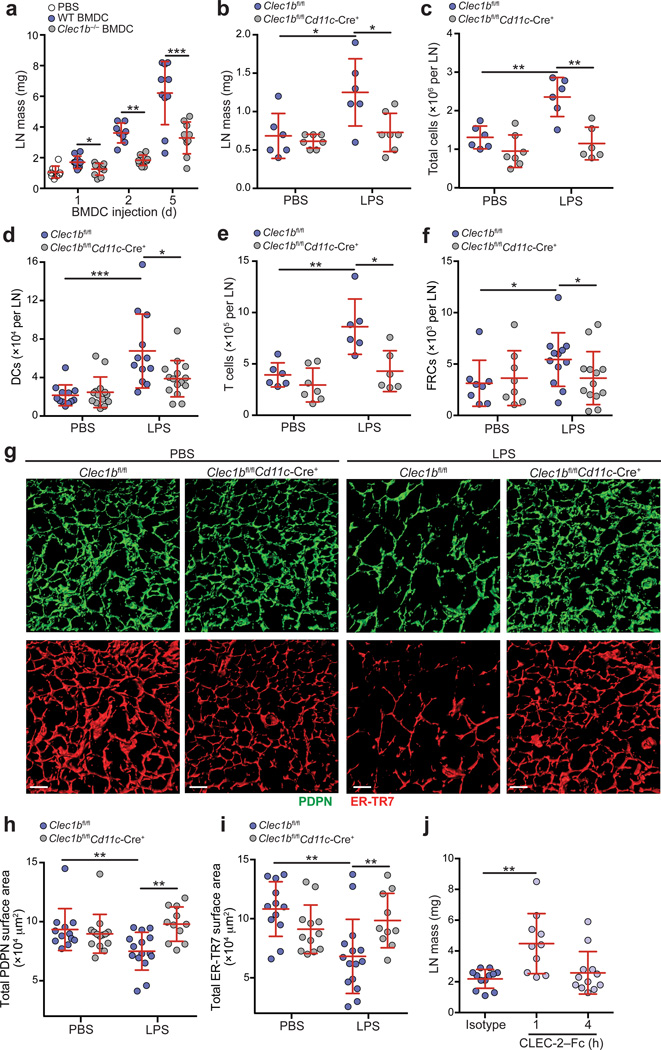
In lymph nodes, fibroblastic reticular cells (FRCs) form a collagen-based reticular network that supports migratory dendritic cells (DCs) and T cells and transports lymph. A hallmark of FRCs is their propensity to contract collagen, yet this function is poorly understood. Here we demonstrate that podoplanin (PDPN) regulates actomyosin contractility in FRCs. Under resting conditions, when FRCs are unlikely to encounter mature DCs expressing the PDPN receptor CLEC-2, PDPN endowed FRCs with contractile function and exerted tension within the reticulum. Upon inflammation, CLEC-2 on mature DCs potently attenuated PDPN-mediated contractility, which resulted in FRC relaxation and reduced tissue stiffness. Disrupting PDPN function altered the homeostasis and spacing of FRCs and T cells, which resulted in an expanded reticular network and enhanced immunity.


Figures

Figure 1
Figure 1. PDPN controls FRC spreading, elongation, and actomyosin contractility
(a) Confocal images of wild-type and Pdpn−/− FRCs seeded into 3D gels. Scale bar, 100 µm in low magnification images (left) and 20 µm in high magnification images (right). Numbers indicate the morphology index value for the cell pictured. (b) Quantification of FRC elongation (morphology index = perimeter2/4πarea). (c,d) Graphs depict the number of protrusions per cell (c) and the lengths of individual protrusions (d) of FRCs. Data points represent cells from 3 independent experiments (mean±s.d., n>50 cells from 5 mice per experiment). (e) Quantification of the area covered by FRCs as they spread in collagen-based matrices. (f) Relative amount that Pdpn−/− FRCs contracted collagen gels relative to wild-type FRCs. Data representative 5 independent experiments (mean±s.d., 3 wells per experiment). (g) Percentages of nuclear-localized YAP in wild-type and Pdpn−/− FRCs plated on coverslips. Data are representative of 3 independent experiments (mean±s.d.; n>37 cells per condition). *P<0.0001 (Mann Whitney test (a-e,g) or one sample t-test (f)).
Figure 2
Figure 2. The PDPN cytoplasmic tail controls elongation but is dispensable for contraction
(a) Confocal images of wild-type and Δcyto FRCs seeded into 3D gels. Scale bar, 100 µm in low magnification images (left) and 20 µm in high magnification images (right). Numbers indicate the morphology index value for that cell. (b) Quantification of FRC morphology index. (c,d) Graphs depicting the number of protrusions per cell (c) and the lengths of individual protrusions (d) for the FRCs. Data points represent individual cells from 3 independent experiments (mean±s.d., n>50 cells per experiment). (e) Relative amount that Pdpn−/− and Δcyto FRCs contracted collagen gels relative to wild-type FRCs. Data are representative of 3–8 independent experiments (mean±s.d.). (f) Graph indicating percentage of active nuclear YAP in FRCs. Data are representative of 2 independent experiments (n>9 cells per experiment). n.s., not significant; *P<0.01; **P<0.0001 (Mann Whitney test (a-d,f) or one sample t-test (e)).
Figure 3
Figure 3. PDPN signals through ERM and MLC to control contraction
(a) Representative images depicted p-ezrin staining in wild-type, Pdpn−/−, and Δcyto FRCs. Scale bar, 10 µm. (b) Representative immunoblot of the abundance of total and activated ERM proteins in FRCs. (c) Representative images of p-MLC staining in wild-type, Pdpn−/−, and Δcyto FRCs. Scale bar, 10 µm. (d) Immunoblot of p-MLC levels in these FRCs. (e) Immunoblots of total and active RhoA in wild-type, Pdpn−/−, and Δcyto FRCs. Numbers indicate relative band densities. Data are representative of 3–5 independent experiments.
Figure 4
Figure 4. PDPN maintains normal FRC proliferation and survival
(a) Graph indicating the relative number of cells present over 4 days of culture as measured by ATP content. Data are representative of 3 independent experiments (mean±s.d., 3 wells per experiment). (b,c) Representative histograms indicating CFSE content in wild-type, Pdpn−/−, and Δcyto FRCs after 48 (b) or 96 (c) days of culture. Numbers indicate the MFI for each condition. (d) Representative flow cytometry plots of Annexin V and 7-AAD staining of FRCs. Numbers indicate percentage of Annexin V+ cells. (e) Quantification of Annexin V+ FRCs from 4 independent experiments. *p<0.05 (Student’s t-test (a) or Mann Whitney test (e)).
Figure 5
Figure 5. In vivo blockade of PDPN results in enlarged LNs, FRC proliferation, and a reorganization of the FRC network
(a) Graph indicating LN mass from mice 48 h after i.v. injection of an isotype or PDPN-specific antibody. (b) Total LN cellularity from isotype- or anti-PDPN-treated mice. Data represent 4 independent experiments (mean±s.d.; n>3 mice/group per experiment). (c) Stiffness of LNs from mice treated with isotype or anti-PDPN antibody for 48 h. Data represent 3 independent experiments (mean±s.d.; n>3 mice/group per experiment). (d) Graph indicating the number of BrdU+ FRCs in LNs from mice treated with an isotype control or anti-PDPN antibody. Data are representative of 3 independent experiments (mean±s.d.; n=4 mice/group). (e) Total numbers of FRCs (PICD45CD31PDPN+ cells) in LNs from mice treated with the isotype or PDPN-specific antibody. Data are representative of 3 independent experiments (mean±s.d., n=3–4 mice per experiment). (f) Masses of LNs from wild-type or Δcyto mice. (g,h) Total cellularity (g) and FRC numbers (h) in LNs from wild-type and Δcyto mice. Data are representative of 3 independent experiments (mean±s.d., n=6–7 mice from 2–3 experiments). (i) Confocal z-stacks were analyzed in 3D in Imaris, and isosurfaces were generated. Representative images of the FRC network in isotype- and anti-PDPN-treated mice. Scale bar represents 20 µm. (j,k) The total surface area covered by the eYFP (j) and ER-TR7 (k) signals. Data are representative of 3 independent experiments (mean±s.d., n>8 fields from 4 mice per experiment). (l) Representative images of the FRC network in wild-type and Δcyto mice. Scale bar represents 20 µm. (m,n) The total surface area covered by the PDPN (m) and ER-TR7 (n) signals. Data are representative of 3 independent experiments (mean±s.d., n>8 fields from 4 mice per experiment). (o) The distance between the nuclei of neighboring FRCs in LN from isotype- or anti-PDPN-treated mice. Data are representative of 2 independent experiments (n>2,600 nuclei from >8 fields from 2–3 mice per experiment). n.s., not significant; *P<0.05; **P<0.01; ***P<0.001 ***P<0.0001 (Mann Whitney test).
Figure 6
Figure 6. PDPN is required to control lymph node swelling and T cell proliferation following immunization
Mice were injected with the PDPN-specific antibody and then received OT-I T cells, LPS, and OVA 48 h later. (a) Number of transferred OT-I T cells in isotype- or anti-PDPN-treated mice 96 h after immunization. (b) The percentage of OT-I cells that divided at least once 48 h after immunization. Data are representative of 4 independent experiments (mean±s.d. n=4 mice per group per experiment). (c) The percentage of T cells in contact with the FRC network in LN treated with the isotype control or PDPN-specific antibody. Data are representative of 2 independent experiments (n=2–3 fields of view from 3 mice per group). *p<0.05; **p<0.01; (Mann Whitney test).
Figure 7
Figure 7. CLEC-2 engagement of PDPN phenocopies genetic deletion of PDPN
(a) Confocal images of control- and CLEC-2-Fc-treated wild-type FRCs. Scale bar indicates 100 µm in low magnification images (left) and 20 µm in high magnification images (right). (b) The morphology index for wild-type FRCs treated with CLEC-2-Fc for the indicated times. (c) Morphology index of FRCs co-cultured with wild-type or Clec1b−/− BMDCs that were either untreated or stimulated overnight with LPS. (d) Morphology index of FRCs co-cultured with wild-type or Clec1b−/− platelets. Data represent 3 independent experiments (mean±s.d.; n>60 cells from 5 mice for each condition). (e) Images of PDPN staining in control- or CLEC-2-Fc-treated wild-type FRCs. Middle, example of PDPN clustering; Bottom, example of FRC-rich protrusions. Scale bar indicates 5 µm. (f) Quantification of the percentage of FRCs exhibiting PDPN clustering or protrusions in response to CLEC-2-Fc treatment. (g) Relative amount that CLEC-2-Fc-treated wild-type, Pdpn−/−, and Δcyto FRCs contracted collagen gels, relative to control-treated wild-type, Pdpn−/−, and Δcyto FRCs, respectively. Data represent 3–5 independent experiments (mean±s.d., 3 wells per experiment). (h,i) Percentage of nuclear-localized YAP in control- or CLEC-2-Fc-treated in FRCs from wild-type (h) or Δcyto (i) mice after 24 h. Data are representative of 3 independent experiments (n>10 cells per experiment). (j,k) Representative immunoblots of p-ERM (j) and p-MLC (k) in wild-type FRCs treated with CLEC-2-Fc for the indicated times. Numbers indicate relative band densities. n.s., not significant; *P<0.05; **P<0.01; ***P<0.001; ****P<0.0001 (Mann Whitney test (b-d,f,h,i) or one sample t-test (g)).
Figure 8
Figure 8. CLEC-2 signals from migratory DCs are required for expansion of LNs and the FRC network in response to immunization
(a) Mice were injected with wild-type or Clec1b−/− BMDCs in the footpad, and the draining LNs were weighed 1, 2, and 5 days later. (b-f) Clec1bfl/fl and Clec1bfl/flCd11c–Cre+ mice were injected into the footpad with PBS or 8 µg of LPS and popliteal LNs were collected 24 h later. Graphs depict LN mass (b), total cellularity (c), and number of DCs (d), T cells (e), and FRCs (f) present in the LNs. Data are representative of 4 independent experiments (mean±s.d. n≥3 mice per experiment). (g) Representative images of the FRC network in LNs from Clec1bfl/fl and Clec1bfl/flCd11c–Cre+ mice. Confocal z-stacks were imaged in 3D and isosurfaces were generated. (h,i) Quantification of the total surface area covered by the PDPN (h) and ER-TR7 (i) stains in g. Data are representative of 2 independent experiments (mean±s.d. n=8–9 fields of view from LNs of 3–4 mice per experiment). (j) Masses of LNs from wild-type mice treated i.v. with an isotype control or CLEC-2-Fc for 1 or 4 h. Data are representative of two independent experiments (n=3 mice per group per experiment). *P<0.05; **P<0.01; *** P<0.0001 (Mann Whitney test).

References

    1. Andrian, von UH, Mempel TR. Homing and cellular traffic in lymph nodes. Nat. Rev. Immunol. 2003;3:867–878. - PubMed
    1. Kumamoto Y, Mattei LM, Sellers S, Payne GW, Iwasaki A. CD4+ T cells support cytotoxic T lymphocyte priming by controlling lymph node input. P. Natl. Acad. Sci. USA. 2011;108:8749–8754. - PMC - PubMed
    1. Tzeng TC, et al. CD11chi Dendritic Cells Regulate the Re-establishment of Vascular Quiescence and Stabilization after Immune Stimulation of Lymph Nodes. J. Immunol. 2010;184:4247–4257. - PMC - PubMed
    1. Chyou S, et al. Coordinated Regulation of Lymph Node Vascular-Stromal Growth First by CD11c+ Cells and Then by T and B Cells. J. Immunol. 2011;187:5558–5567. - PMC - PubMed
    1. Turley SJ, Fletcher AL, Elpek KG. The stromal and haematopoietic antigen-presenting cells that reside in secondary lymphoid organs. Nat. Rev. Immunol. 2010;10:813–825. - PubMed

Publication types

MeSH terms