. 2014 Jul 16;2(7):e12051.
doi: 10.14814/phy2.12051.

Exploring the physiologic role of human gastroesophageal reflux by analyzing time-series data from 24-h gastric and esophageal pH recordings

Affiliations

Exploring the physiologic role of human gastroesophageal reflux by analyzing time-series data from 24-h gastric and esophageal pH recordings

Luo Lu et al. Physiol Rep. .

Abstract

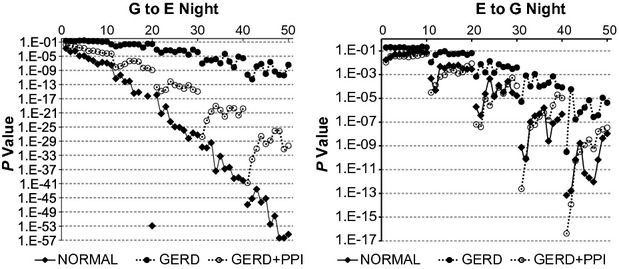
Our previous finding of a fractal pattern for gastric pH and esophageal pH plus the statistical association of sequential pH values for up to 2 h led to our hypothesis that the fractal pattern encodes information regarding gastric acidity and that depending on the value of gastric acidity, the esophagus can signal the stomach to alter gastric acidity by influencing gastric secretion of acid or bicarbonate. Under our hypothesis values of gastric pH should provide information regarding values of esophageal pH and vice versa. We used vector autoregression, a theory-free set of inter-related linear regressions used to measure relationships that can change over time, to analyze data from 24-h recordings of gastric pH and esophageal pH. We found that in pH records from normal subjects, as well as from subjects with gastroesophageal reflux disease alone and after treatment with a proton pump inhibitor, gastric pH values provided important information regarding subsequent values of esophageal pH and values of esophageal pH provided important information regarding subsequent values of gastric pH. The ability of gastric pH and esophageal pH to provide information regarding subsequent values of each other was reduced in subjects with gastroesophageal reflux disease compared to normal subjects. Our findings are consistent with the hypothesis that depending on the value of gastric acidity, the esophagus can signal the stomach to alter gastric acidity, and that this ability is impaired in subjects with gastroesophageal reflux disease.

Keywords: Esophageal pH; gastric pH; gastroesophageal reflux; vector autoregression.


Figures

Figure 1.
Figure 1.
Representative 24‐h recording of gastric and esophageal pH from a normal healthy subject. Gastric and esophageal pH were recorded every 4th second for 24 h. Standard meals were ingested over 30 min at hours 1, 4 and 10.
Figure 2.
Figure 2.
Fraction of 24‐h records from vector autoregression (VAR) for which the complicated model provides a significantly better fit of the data than the simpler model (P < 0.05 by F‐test). G to E refers to a comparison of VAR of esophageal pH alone to VAR of esophageal pH plus gastric pH. E to G refers to a comparison of VAR of gastric pH alone to VAR of gastric pH plus esophageal pH. Results are from 26 normal subjects and from 27 gastroesophageal reflux disease (GERD) subjects. On the X axis, values 1–10 indicate bins 1–10 with lag 1; values 11–20 indicate bins 1–10 with lag 2; values 21–30 indicate bins 1–10 with lag 3; values 31–40 indicate bins 1–10 with lag 4; and values 41–50 indicate bins 1–10 with lag 5.
Figure 3.
Figure 3.
P‐values from F‐test for 24‐h records from vector autoregression (VAR) comparing the complicated model to the simpler model. G to E refers to a comparison of VAR of esophageal pH alone to VAR of esophageal pH plus gastric pH. E to G refers to a comparison of VAR of gastric pH alone to VAR of gastric pH plus esophageal pH. Results are medians from 26 normal subjects and from 27 gastroesophageal reflux disease (GERD) subjects. On the X axis, values 1–10 indicate bins 1–10 with lag 1; values 11–20 indicate bins 1–10 with lag 2; values 21–30 indicate bins 1–10 with lag 3; values 31–40 indicate bins 1–10 with lag 4; and values 41–50 indicate bins 1–10 with lag 5. Notice the different scales on the Y‐axes.
Figure 4.
Figure 4.
Values for variance for 24‐h records from vector autoregression (VAR) comparing the complicated model to the simpler model. E ALONE and G ALONE refer to VAR of the simpler model – esophageal pH alone and gastric pH alone, respectively. G to E and E TO G refer to VAR of the complicated model – esophageal pH plus gastric pH and gastric pH plus esophageal pH, respectively Results are medians from 26 normal subjects and from 27 gastroesophageal reflux disease (GERD) subjects. On the X axis, values 1–10 indicate bins 1–10 with lag 1; values 11–20 indicate bins 1–10 with lag 2; values 21–30 indicate bins 1–10 with lag 3; values 31–40 indicate bins 1–10 with lag 4; and values 41–50 indicate bins 1–10 with lag 5.
Figure 5.
Figure 5.
Fraction of daytime records from vector autoregression (VAR) for which the complicated model provides a significantly better fit of the data than the simpler model (P < 0.05 by F‐test). Daytime was from the beginning of the recording until the end of hour 14. G to E refers to a comparison of VAR of esophageal pH alone to VAR of esophageal pH plus gastric pH. E to G refers to a comparison of VAR of gastric pH alone to VAR of gastric pH plus esophageal pH. Results are from 26 normal subjects and from 27 gastroesophageal reflux disease (GERD) subjects. On the X axis, values 1–10 indicate bins 1–10 with lag 1; values 11–20 indicate bins 1–10 with lag 2; values 21–30 indicate bins 1–10 with lag 3; values 31–40 indicate bins 1–10 with lag 4; and values 41–50 indicate bins 1–10 with lag 5.
Figure 6.
Figure 6.
Fraction of nighttime records from vector autoregression (VAR) for which the complicated model provides a significantly better fit of the data than the simpler model (P < 0.05 by F‐test). Nighttime was from the beginning of hour 15 until the end of the recording. G to E refers to a comparison of VAR of esophageal pH alone to VAR of esophageal pH plus gastric pH. E to G refers to a comparison of VAR of gastric pH alone to VAR of gastric pH plus esophageal pH. Results are from 26 normal subjects and from 27 gastroesophageal reflux disease (GERD) subjects. On the X axis, values 1–10 indicate bins 1–10 with lag 1; values 11–20 indicate bins 1–10 with lag 2; values 21–30 indicate bins 1–10 with lag 3; values 31–40 indicate bins 1–10 with lag 4; and values 41–50 indicate bins 1–10 with lag 5.
Figure 7.
Figure 7.
P‐values from F‐test for daytime records from vector autoregression (VAR) comparing the complicated model to the simpler model. G to E refers to a comparison of VAR of esophageal pH alone to VAR of esophageal pH plus gastric pH. E to G refers to a comparison of VAR of gastric pH alone to VAR of gastric pH plus esophageal pH. Results are medians from 26 normal subjects and from 27 gastroesophageal reflux disease (GERD) subjects. On the X axis, values 1–10 indicate bins 1–10 with lag 1; values 11–20 indicate bins 1–10 with lag 2; values 21–30 indicate bins 1–10 with lag 3; values 31–40 indicate bins 1–10 with lag 4; and values 41–50 indicate bins 1–10 with lag 5. Notice the different scales on the Y‐axes.
Figure 8.
Figure 8.
P‐values from F‐test for nighttime records from vector autoregression (VAR) comparing the complicated model to the simpler model. G to E refers to a comparison of VAR of esophageal pH alone to VAR of esophageal pH plus gastric pH. E to G refers to a comparison of VAR of gastric pH alone to VAR of gastric pH plus esophageal pH. Results are medians from 26 normal subjects and from 27 gastroesophageal reflux disease (GERD) subjects. On the X axis, values 1–10 indicate bins 1–10 with lag 1; values 11–20 indicate bins 1–10 with lag 2; values 21–30 indicate bins 1–10 with lag 3; values 31–40 indicate bins 1–10 with lag 4; and values 41–50 indicate bins 1–10 with lag 5. Notice the different scales on the Y‐axes and the outlier in the left panel.

References

    1. Blondeau K., Sifrim D., Gardner J. D. 2009. Continuous distal oesophageal acidification decreases postprandial gastric acidity in healthy human subjects. Aliment. Pharmacol. Ther.; 29:561-570. - PubMed
    1. Bringmann L. F., Vissers N., Wichers M., Geschwind N., Kuppens P., Peeters F. 2013. A network approach to psychopathology: new insights into clinical longitudinal data. PLoS ONE; 8:e60188. - PMC - PubMed
    1. Chen G., Glen G. R., Saad Z. S., Paul Hamilton J., Thomason M. E., Gotlib I. H. 2011. Vector autoregression, structural equation modelling, and their synthesis in neuroimaging analysis. Comput. Biol. Med.; 41:1142-1155. - PMC - PubMed
    1. Clarke A. T., Wirz A. A., Seenan J. P., Manning J. J., Gillen D., McColl K. E. L. 2009. Paradox of gastric cardia: it becomes more acidic following meals while the rest of the stomach becomes less acidic. Gut; 58:904-909. - PubMed
    1. Dhoray S., Teelucksingh S. S. 2007. The implications of ecosystem dynamics for fisheries management: a case study of selected fisheries in the Gulf of Paria, Trinidad. J. Environ. Manage.; 85:415-428. - PubMed

LinkOut - more resources