. 2014 Oct 28:5:5217.
doi: 10.1038/ncomms6217.

RNAi-based functional selection identifies novel cell migration determinants dependent on PI3K and AKT pathways

Affiliations

RNAi-based functional selection identifies novel cell migration determinants dependent on PI3K and AKT pathways

Minchul Seo et al. Nat Commun. .

Abstract

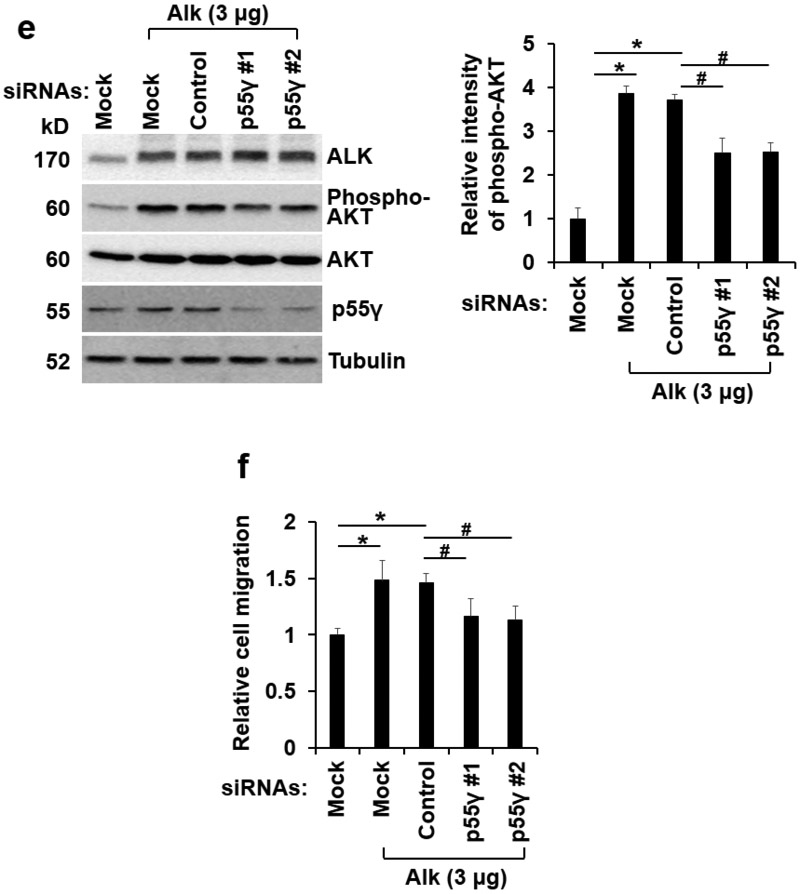
Lentiviral short hairpin RNA (shRNA)-mediated genetic screening is a powerful tool for identifying loss-of-function phenotype in mammalian cells. Here, we report the identification of 91 cell migration-regulating genes using unbiased genome-wide functional genetic selection. Individual knockdown or cDNA overexpression of a set of 10 candidates reveals that most of these cell migration determinants are strongly dependent on the PI3K/PTEN/AKT pathway and on their downstream signals, such as FOXO1 and p70S6K1. ALK, one of the cell migration promoting genes, uniquely uses p55γ regulatory subunit of PI3K, rather than more common p85 subunit, to trigger the activation of the PI3K-AKT pathway. Our method enables the rapid and cost-effective genome-wide selection of cell migration regulators. Our results emphasize the importance of the PI3K/PTEN/AKT pathway as a point of convergence for multiple regulators of cell migration.


Figures

Figure 1.
Figure 1.. Schematic representation of the RNAi-based selection of cell migration regulators.
(a) Overview of the selection procedure. The production and infection of genome-wide lentiviral shRNA library are described in Methods. Two days after lentiviral infection, NIH3T3 mouse fibroblast cells were seeded onto transwell inserts and allowed to migrate across the porous membrane at 37°C for 5 or 24 hr, to select cells with an increased or decreased migration phenotype, respectively. Migrated or non-migrated cells were collected by trypsin-EDTA treatment from the lower or upper faces, respectively, of inserts, and reseeded onto transwell culture inserts for a second round of selection (this process was repeated five times). After the final round of selection, shRNAs were retrieved by PCR from selected cells and identified by sequencing. (b) Diagram of pHAGE-mir30-RFP-shRNA vector. The pooled lentiviral vector contained 63,996 different mir30-based shRNAs targeting 21,332 mouse genes.
Figure 2.
Figure 2.. Construction of the signaling network of cell migration regulators and their classification based on biological functions.
(a) A relevant signaling network was constructed from the 91 cell migration-regulating genes identified by Ingenuity Pathway Analysis (IPA). Newly identified cell migration regulators were linked to various previously reported cell movement signaling components (yellow). Green, cell migration–accelerating genes; blue, cell migration–accelerating genes validated by siRNA; pink, cell migration-impairing genes; red, cell migration–impairing genes validated by siRNA study. PI3K and AKT are highlighted in brown. (b) The biological functions of cell migration regulators were categorized by IPA analysis, which showed; 41% were cell movement and morphology related, 21% were cellular assembly and organization related, 20% were cell-to-cell signaling related, and 18% were protein trafficking and molecular transport related.
Figure 3.
Figure 3.. Validation of the gene targets found by the RNAi-based functional selection.
(a) NIH3T3 fibroblast cells were transiently transfected with control siRNA or one of five siRNAs (#1 to #5) targeting mtmr1, lats2, dock3, myo5a, or ptpn14. At 24 hr after transfection, wound-healing assays were performed to evaluate cell migration. (b) Efficiencies of siRNA-mediated target gene knockdown were confirmed by RT-PCR followed by densitometric analysis. (c) NIH3T3 cells were transiently transfected with control siRNA or one of five siRNAs (#1 to #5) for each target gene identified (csnk2a2, arid4a, ppp3cc, irf4, and alk). After 24 hr, wound-healing assays were performed to evaluate cell migration. Cell migration was quantified by measuring degrees of wound closure, as described in Methods. The results shown are means ± SDs (n = 3). *p < 0.05 represents significantly different from control siRNA-transfected cells. (d) Efficiencies of siRNA-mediated target gene knockdown were confirmed by RT-PCR and densitometric analysis. β-actin was used as the internal control. The results are means ± SDs (n = 3); * p values of < 0.05 indicate significantly different from control siRNA-transfected cells.
Figure 4.
Figure 4.. Validation of shRNA hits by three-dimensional cell migration assay.
(a, b) NIH3T3 fibroblast cells were transiently transfected with siRNAs targeting cell migration inhibitors (a) or promoters (b). One siRNA was used for each target: mtmr1 (#5), lats2 (#3), dock3 (#1), myo5a (#3), ptpn14 (#5), csnk2a2 (#1), arid4a (#1), ppp3cc (#3), irf4 (#4), or alk (#3). #1 to #5 indicate the siRNAs used for validation in Fig 3. After 24 hr of transfection, NIH3T3 fibroblast cells (4 × 10⁴ cells/well) were seeded onto transwell inserts and incubated at 37°C for 6 hr (a; cell migration-accelerating siRNAs) or 9 hr (b; cell migration-impairing siRNAs). Non-migrated cells were removed from the upper face of the transwell insert using a cotton swab. Cells that migrated through membranes were stained and counted in 5 randomly selected fields. The results are representative of three independent experiments (left) or means ± SDs (n = 3) (right). *p < 0.05 represents significantly different from control siRNA-transfected NIH3T3 cells. Scale bar = 200 μm. (c, d) L929 fibroblast cells or mouse embryonic fibroblasts (MEF) were transiently transfected with cell migration-accelerating (c) or impairing (d) siRNAs identified from the screen. After 24 hr of transfection, L929 or MEF cells (4 × 10⁴ cells/well) were seeded onto the transwell culture inserts and incubated at 37°C for 6 - 9 hr. After incubation, nonmigrated cells were removed from the upper face of the transwell culture insert using a cotton swab. The cells that migrated across the membrane were stained and counted as described in the main text. The results are mean ± SD (n = 3). *p < 0.05 represents significantly different from control siRNA-transfected L929 cells. #p < 0.05 represents different from control siRNA-transfected MEF cells.
Figure 5.
Figure 5.. Induction of AKT activation by the selected cell migration regulators.
NIH3T3 fibroblast cells were transiently transfected with control siRNA, siRNAs against dock3 (#1), mtmr1 (#5), ptpn14 (#5), lats2 (#3), or myo5a (#3) (a) or empty vectors (pcDNA3 or pFlag), alk or irf4 expression constructs (pcDNA3-alk or pFlag-irf4) (b,c). After 48 hr, levels of phosphorylated AKT (phospho-AKT at Ser473) or total AKT protein were evaluated by Western blot analysis (upper). Ponceau S staining was performed to confirm equal sample loading. The results of densitometric analysis are also shown (lower). The results shown are means ± SDs (n = 3); *p values of < 0.05 indicate significantly different from control siRNA- or empty vector-transfected cells. (d) Overexpression of ALK or IRF4 in transfectants was confirmed by Western blotting using anti-ALK or -FLAG-tag antibody. Tubulin was used as the internal control.
Figure 6.
Figure 6.. Dependences of selected cell migration regulators on the PI3K/AKT pathway.
(a) NIH3T3 cells were transiently transfected with control siRNA or siRNAs targeting mtmr1 (#5), lats2 (#3), dock3 (#1), myo5a (#3), or ptpn14 (#5). After 24 hr, wound-healing assay was conducted and cell migration was quantified in the presence or absence of AKT inhibitor (5 μM) or PI3K inhibitor (LY294002; 15 μM). The results shown are means ± SDs (n = 3). * p values of < 0.05 indicate significantly different from control siRNA-transfected cells; # p values of < 0.05 indicate significantly different from the corresponding siRNA-transfected cells not treated with inhibitor. (b) Alternatively, NIH3T3 cells were transiently transfected with empty vector (pcDNA3) or alk or irf4 expression constructs (pcDNA3-alk or pFlag-irf4) for 24 hr. Wound-healing assay was performed to evaluate cell migration in the presence or absence of AKT inhibitor (5 μM) or PI3K inhibitor (LY294002; 15 μM). The results shown are means ± SDs (n = 3). * p values of < 0.05 indicate significantly different from pcDNA3 or pFlag empty vector transfected cells; # p values of < 0.05 indicate significantly different from the cells under a similar condition without the inhibitor treatment.
Figure 7.
Figure 7.. Dependence of selected cell migration regulators on PI3K/AKT pathway determined by three-dimensional cell migration assay.
NIH3T3 cells were transiently transfected with either siRNAs targeted for mtmr1, lats2, dock3, myo5a, and ptpn14 (a) or alk and irf4 expression constructs (pcDNA3-alk or pFlag-irf4) (b). After 24 hr of transfection, NIH3T3 fibroblast cells (4 × 10⁴ cells/well) were seeded onto the transwell culture inserts and incubated in the presence or absence of either AKT inhibitor (5 μM) or PI3K inhibitor (LY294002; 15 μM) at 37°C for 6 hr. After incubation, nonmigrated cells were removed from the upper face of the transwell culture insert. The cells that migrated across the membrane were stained and counted as described in the main text. The results are mean ± SD (n = 3). *p < 0.05 represents significantly different from control siRNA-transfected cells; #p < 0.05 represents significantly different from the corresponding siRNA-transfected cells without the inhibitor treatment.
Figure 8.
Figure 8.. Pivotal role of p55γ subunit of PI3K in Alk-mediated cell migration.
(a,b) NIH3T3 fibroblast cells were used to reciprocally immunoprecipitate (IP) with anti-ALK and anti-PI3K antibodies as indicated. Precipitated protein was separated on SDS-PAGE and subjected to reciprocal Western blot analysis (WB) using each antibody. (c) NIH3T3 fibroblast cells were transiently transfected with control vector (pcDNA3) or alk expression constructs (pcDNA3-alk). After 48 hr, levels of phosphorylated or total ALK, p55γ, p85α, and AKT were evaluated by Western blotting. Tubulin was used as a loading control. The results of densitometric analysis (right) are means ± SDs (n = 3); * p values of < 0.05 indicate significantly different from control vector-transfected cells. (d) NIH3T3 fibroblast cells on coverslips were transiently transfected with GFP-akt-PH expression construct and control vector (pcDNA3) or alk expression constructs (pcDNA3-alk). After 36 hr, transfected NIH3T3 fibroblast cells images were obtained using fluorescence microscopy to determine the localization of the GFP-AKT-PH. Arrowheads indicate plasma membrane-localized GFP-AKT-PH. Scale bar = 20 μm. (e) ALK-overexpressing NIH3T3 fibroblast cells were transiently transfected with control siRNA or siRNAs against p55γ. After 48 hr, levels of total or phosphorylated AKT, ALK, and p55γ were evaluated by Western blotting. Tubulin was used as a loading control. The results of phospho-AKT densitometry (right) are means ± SDs (n = 3). (f) After 24 hr of transfection, NIH3T3 fibroblast cells (4 × 10⁴ cells/well) were seeded onto the transwell culture inserts and incubated at 37°C for 9 hr. The cells that migrated across the membrane were stained and counted as described in the main text. The results shown are means ± SDs (n = 3); * p values of < 0.05 indicate significantly different from empty vector-transfected cells. # p values of < 0.05 indicate significantly different from control siRNA-transfected cells.

References

    1. Vicente-Manzanares M, Webb DJ, Horwitz AR. Cell migration at a glance. J Cell Sci 118, 4917–4919 (2005). - PubMed
    1. Franz CM, Jones GE, Ridley AJ. Cell migration in development and disease. Dev Cell 2, 153–158 (2002). - PubMed
    1. Luster AD, Alon R, von Andrian UH. Immune cell migration in inflammation: present and future therapeutic targets. Nat Immunol 6, 1182–1190 (2005). - PubMed
    1. Cram EJ, Shang H, Schwarzbauer JE. A systematic RNA interference screen reveals a cell migration gene network in C. elegans. J Cell Sci 119, 4811–4818 (2006). - PubMed
    1. Wang X, et al. Analysis of cell migration using whole-genome expression profiling of migratory cells in the Drosophila ovary. Dev Cell 10, 483–495 (2006). - PubMed

Publication types

MeSH terms