

Effects of inversion time on inversion recovery prepared ultrashort echo time (IR-UTE) imaging of bound and pore water in cortical bone
- PMID: 25348196
- PMCID: PMC4263352
- DOI: 10.1002/nbm.3228
Effects of inversion time on inversion recovery prepared ultrashort echo time (IR-UTE) imaging of bound and pore water in cortical bone
Abstract
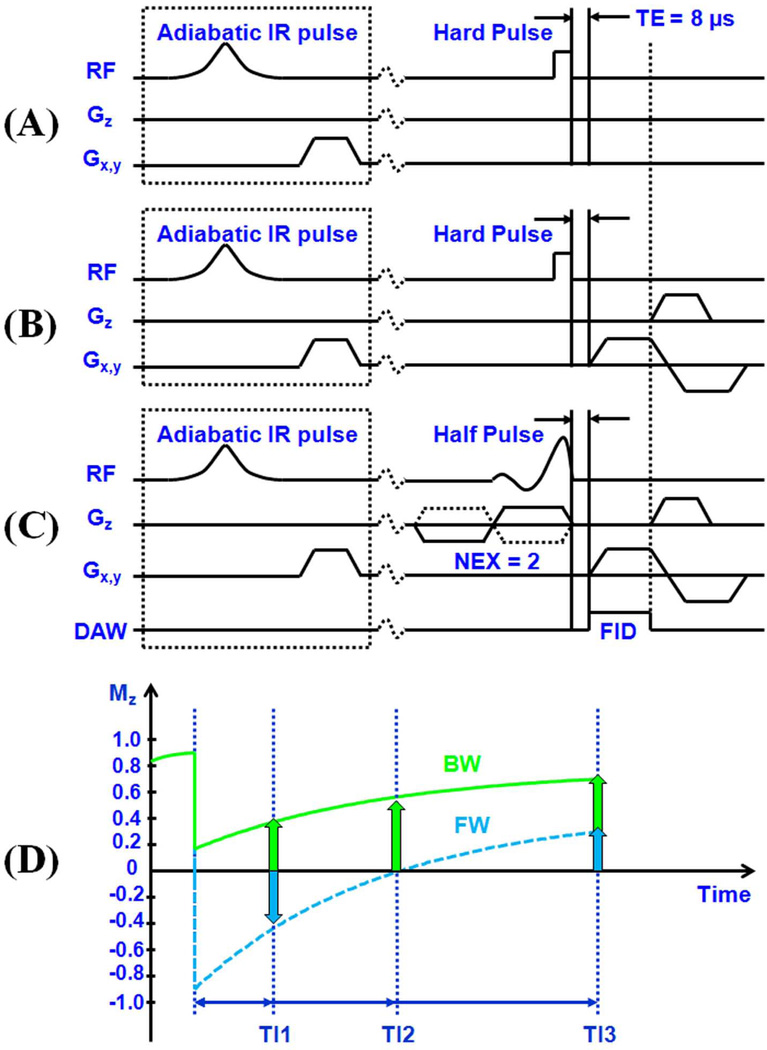
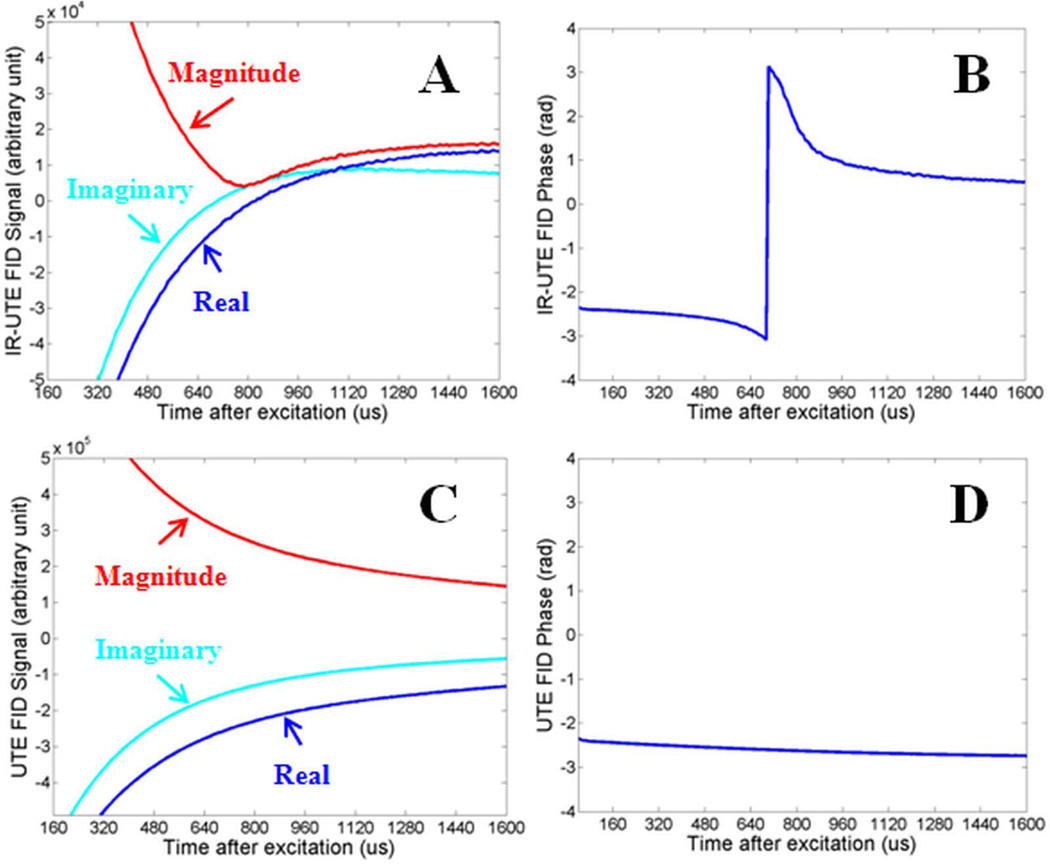
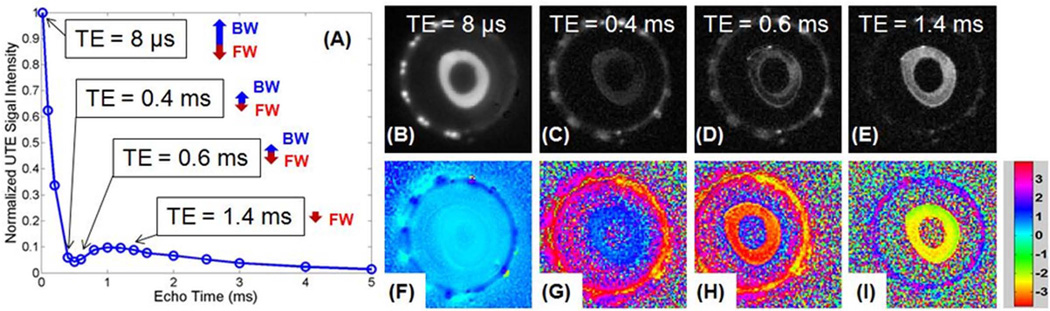
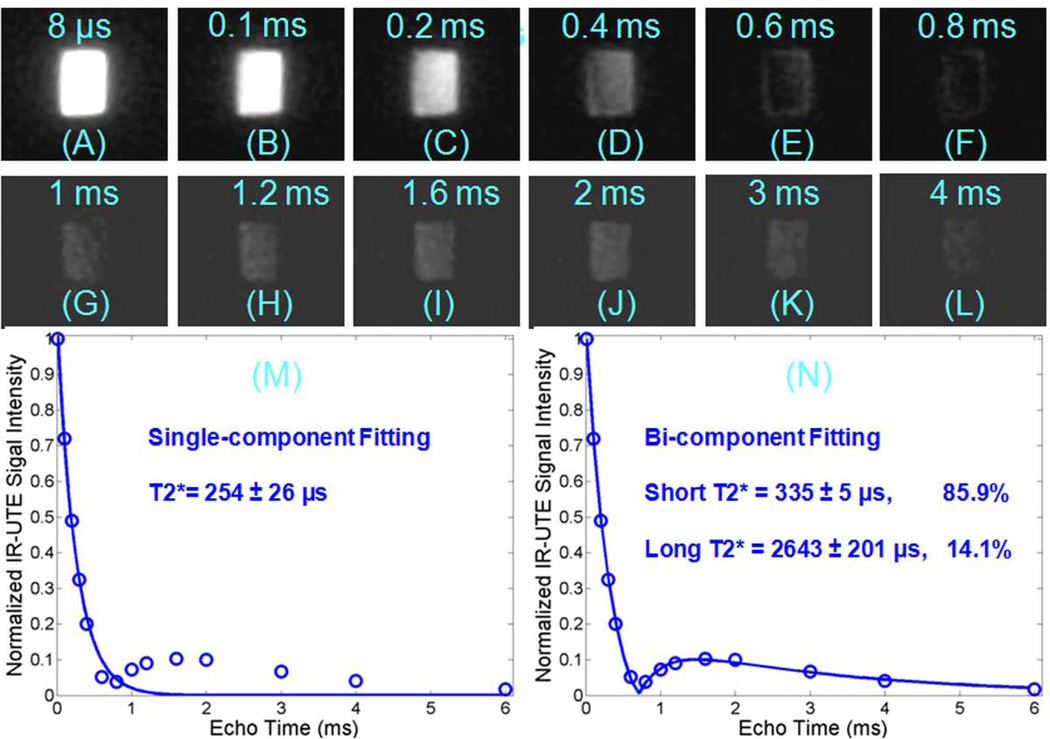
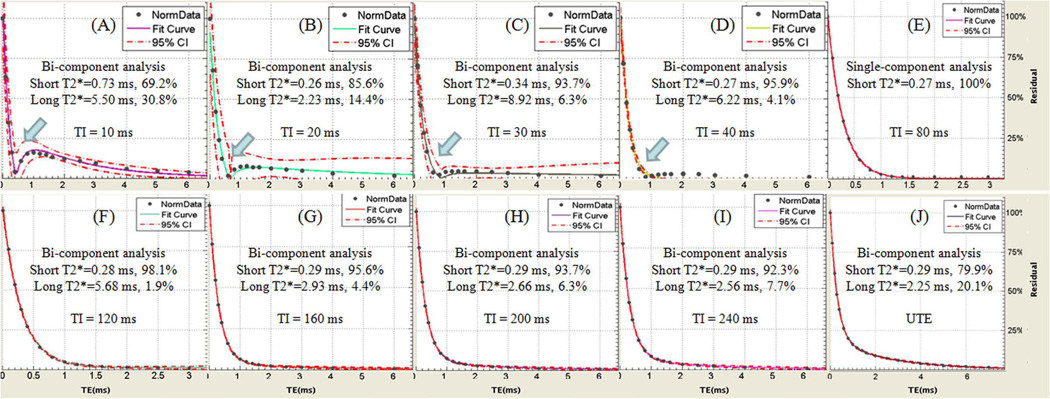
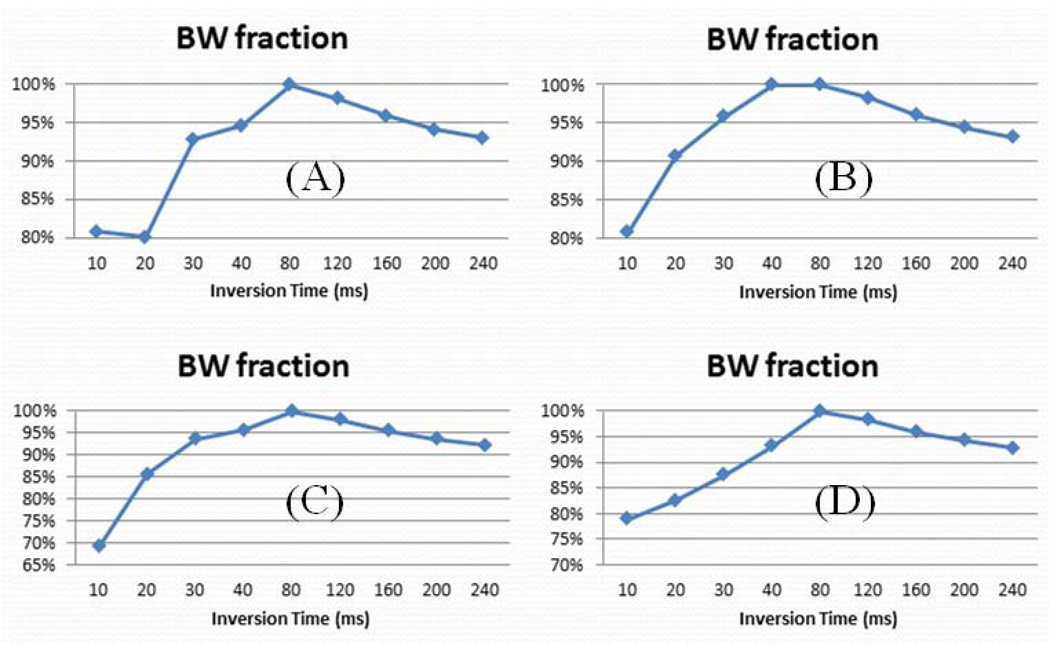
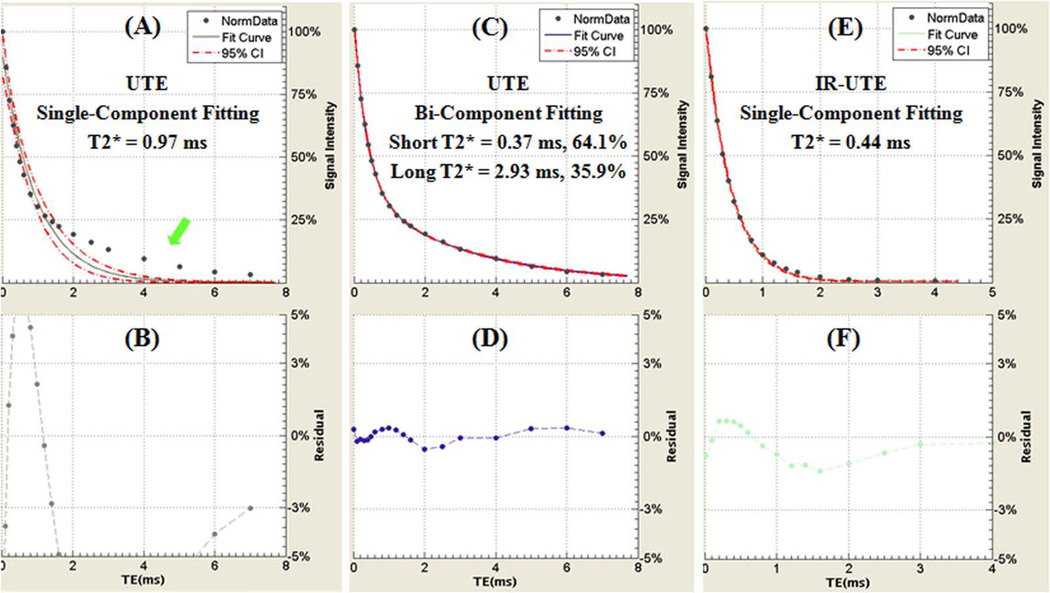
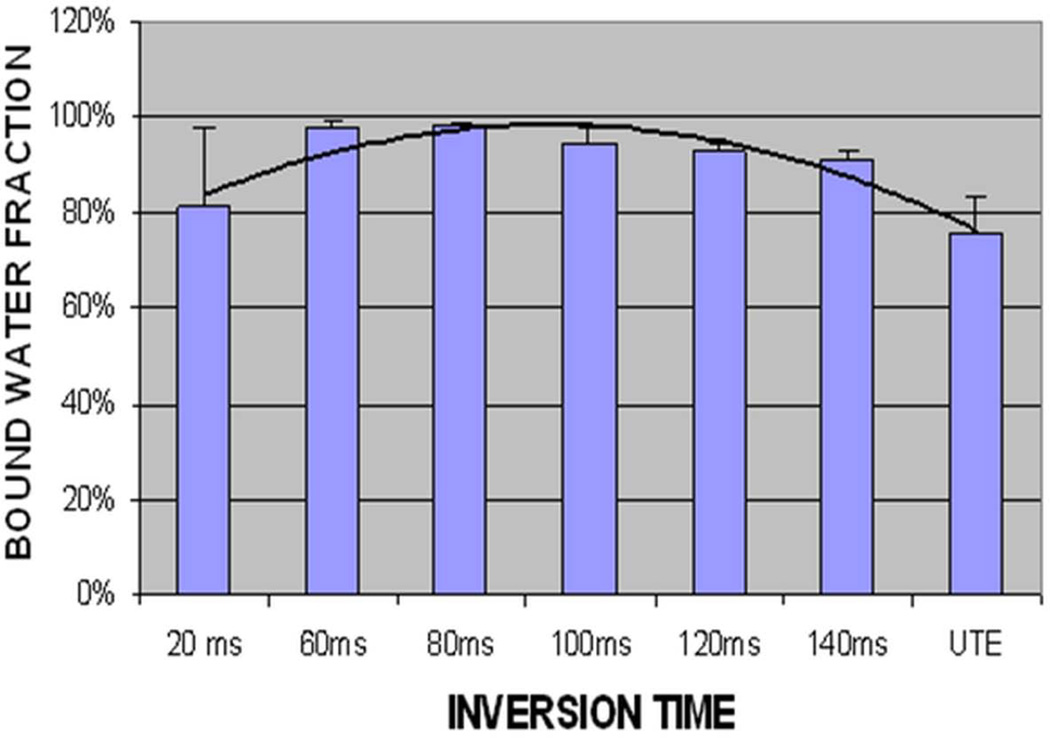
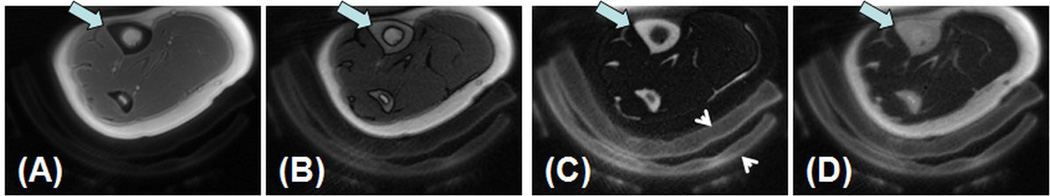
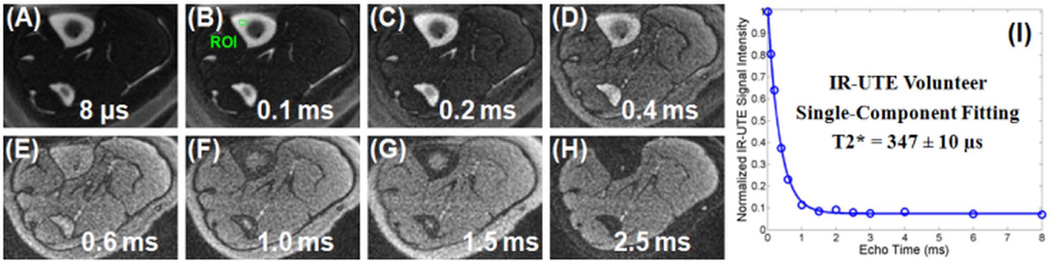
Water is present in cortical bone in different binding states. In this study we aimed to investigate the effects of inversion time (TI) on the signal from bound and pore water in cortical bone using an adiabatic inversion recovery prepared ultrashort echo time (IR-UTE) sequence on a clinical 3 T scanner. In total ten bovine midshaft samples and four human tibial midshaft samples were harvested for this study. Each cortical sample was imaged with the UTE and IR-UTE sequences with a TR of 300 ms and a series of TI values ranging from 10 to 240 ms. Five healthy volunteers were also imaged with the same sequence. Single- and bi-component models were utilized to calculate the T2 * and relative fractions of short and long T2 * components. Bi-component behavior of the signal from cortical bone was seen with the IR-UTE sequence, except with a TI of around 80 ms, where the short T2 * component alone were seen and a mono-exponential decay pattern was observed. In vivo imaging with the IR-UTE sequence provided high contrast-to-noise images with direct visualization of bound water and reduced signal from long T2 muscle and fat. Our preliminary results demonstrate that selective nulling of the pore water component can be achieved with the IR-UTE sequence with an appropriate TI, allowing selective imaging of the bound water component in cortical bone in vivo using clinical MR scanners.
Keywords: IR-UTE; UTE; bound water; cortical bone; pore water.
Copyright © 2014 John Wiley & Sons, Ltd.
Figures
Similar articles
-
Quantitative Ultrashort Echo Time (UTE) Magnetic Resonance Imaging of Bone: An Update.Front Endocrinol (Lausanne). 2020 Sep 18;11:567417. doi: 10.3389/fendo.2020.567417. eCollection 2020. Front Endocrinol (Lausanne). 2020. PMID: 33071975 Free PMC article. Review.
-
Fast volumetric imaging of bound and pore water in cortical bone using three-dimensional ultrashort-TE (UTE) and inversion recovery UTE sequences.NMR Biomed. 2016 Oct;29(10):1373-80. doi: 10.1002/nbm.3579. Epub 2016 Aug 5. NMR Biomed. 2016. PMID: 27496335 Free PMC article.
-
T1 measurement of bound water in cortical bone using 3D adiabatic inversion recovery ultrashort echo time (3D IR-UTE) Cones imaging.Magn Reson Med. 2020 Aug;84(2):634-645. doi: 10.1002/mrm.28140. Epub 2019 Dec 20. Magn Reson Med. 2020. PMID: 31863519 Free PMC article.
-
Three-dimensional adiabatic inversion recovery prepared ultrashort echo time cones (3D IR-UTE-Cones) imaging of cortical bone in the hip.Magn Reson Imaging. 2017 Dec;44:60-64. doi: 10.1016/j.mri.2017.07.012. Epub 2017 Jul 15. Magn Reson Imaging. 2017. PMID: 28716680
-
An Update in Qualitative Imaging of Bone Using Ultrashort Echo Time Magnetic Resonance.Front Endocrinol (Lausanne). 2020 Sep 29;11:555756. doi: 10.3389/fendo.2020.555756. eCollection 2020. Front Endocrinol (Lausanne). 2020. PMID: 33117275 Free PMC article. Review.
Cited by
-
Trabecular bone imaging using a 3D adiabatic inversion recovery prepared ultrashort TE Cones sequence at 3T.Magn Reson Med. 2020 May;83(5):1640-1651. doi: 10.1002/mrm.28027. Epub 2019 Oct 21. Magn Reson Med. 2020. PMID: 31631404 Free PMC article.
-
Visualization of Middle Ear Ossicles in Elder Subjects with Ultra-short Echo Time MR Imaging.Magn Reson Med Sci. 2017 Apr 10;16(2):93-97. doi: 10.2463/mrms.mp.2015-0171. Epub 2016 Mar 21. Magn Reson Med Sci. 2017. PMID: 27001395 Free PMC article.
-
Quantitative Ultrashort Echo Time (UTE) Magnetic Resonance Imaging of Bone: An Update.Front Endocrinol (Lausanne). 2020 Sep 18;11:567417. doi: 10.3389/fendo.2020.567417. eCollection 2020. Front Endocrinol (Lausanne). 2020. PMID: 33071975 Free PMC article. Review.
-
Inversion recovery ultrashort echo time imaging of ultrashort T2 tissue components in ovine brain at 3 T: a sequential D2 O exchange study.NMR Biomed. 2017 Oct;30(10):10.1002/nbm.3767. doi: 10.1002/nbm.3767. Epub 2017 Jul 21. NMR Biomed. 2017. PMID: 28731616 Free PMC article.
-
Feasibility of using an inversion-recovery ultrashort echo time (UTE) sequence for quantification of glenoid bone loss.Skeletal Radiol. 2018 Jul;47(7):973-980. doi: 10.1007/s00256-018-2898-4. Epub 2018 Feb 2. Skeletal Radiol. 2018. PMID: 29396694 Free PMC article.
References
-
- Lees S. A mixed packing model for bone collagen. Calcif Tissue Int. 1981;33(6):591–602. - PubMed
-
- Elliott SR, Robinson RA. The water content of bone. I. The mass of water, inorganic crystals, organic matrix, and CO2 space components in a unit volume of the dog bone. J Bone Joint Surg. Am. 1957;39-A(1):167–188. - PubMed
-
- Cowin SC. Bone poroelasticity. J Biomech. 1999;32(3):217–238. - PubMed
-
- Ni QW, Nyman JS, Wang XD, De Los Santos A, Nicolella DP. Assessment of water distribution changes in human cortical bone by nuclear magnetic resonance. Meas Sci Technol. 2007;18(3):715–723.
Publication types
MeSH terms
Substances
Grants and funding
LinkOut - more resources
Full Text Sources
Other Literature Sources
Medical
