

Activities of antibiotic combinations against resistant strains of Pseudomonas aeruginosa in a model of infected THP-1 monocytes
- PMID: 25348528
- PMCID: PMC4291360
- DOI: 10.1128/AAC.04011-14
Activities of antibiotic combinations against resistant strains of Pseudomonas aeruginosa in a model of infected THP-1 monocytes
Abstract
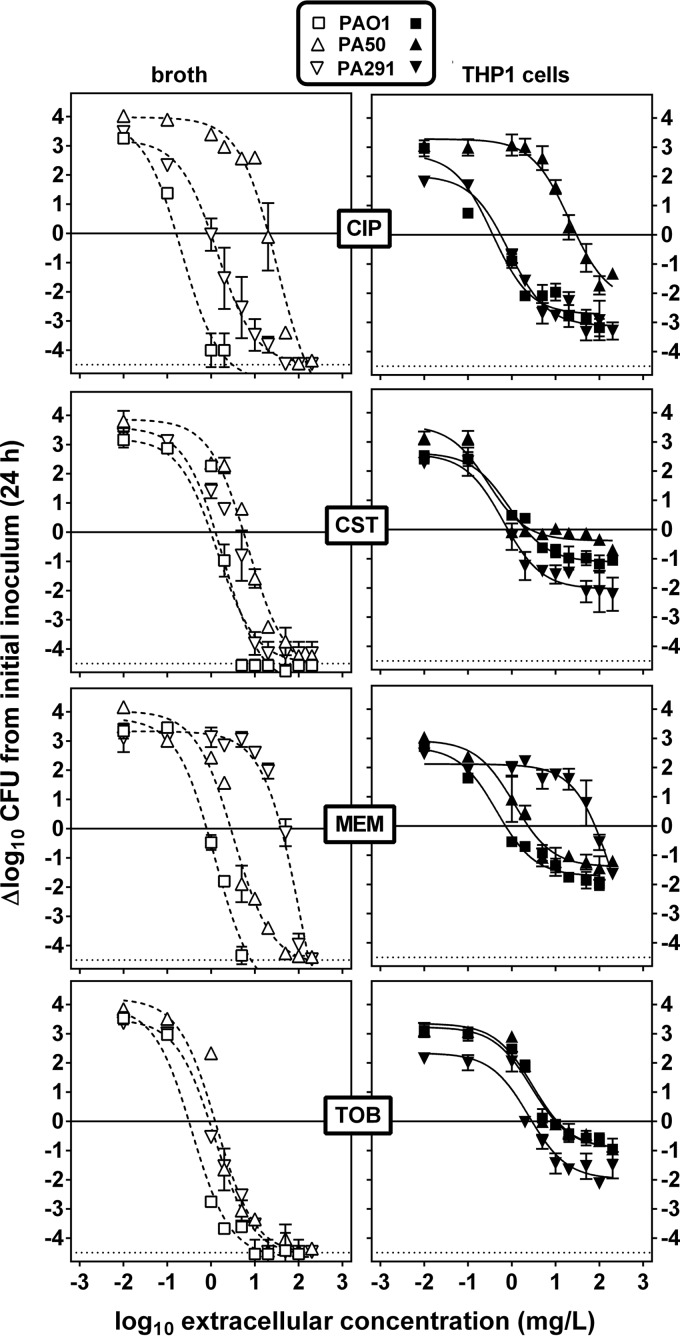
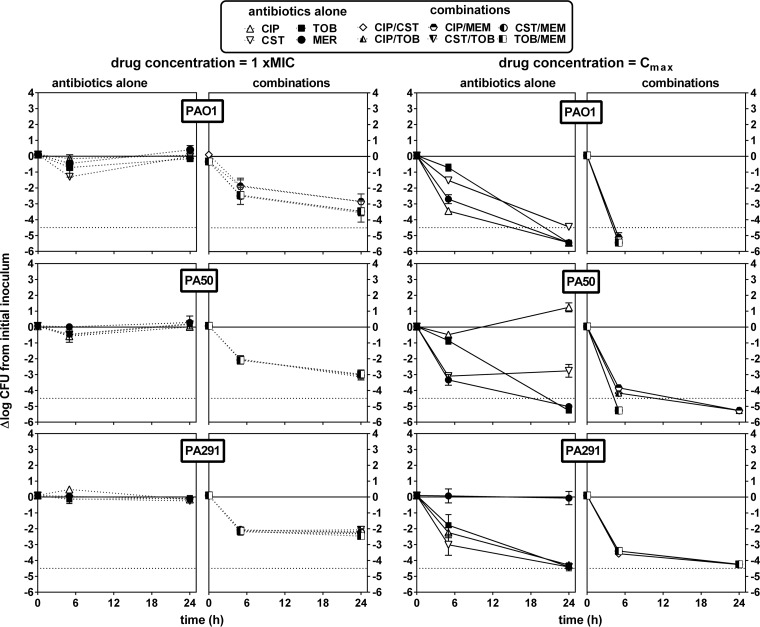
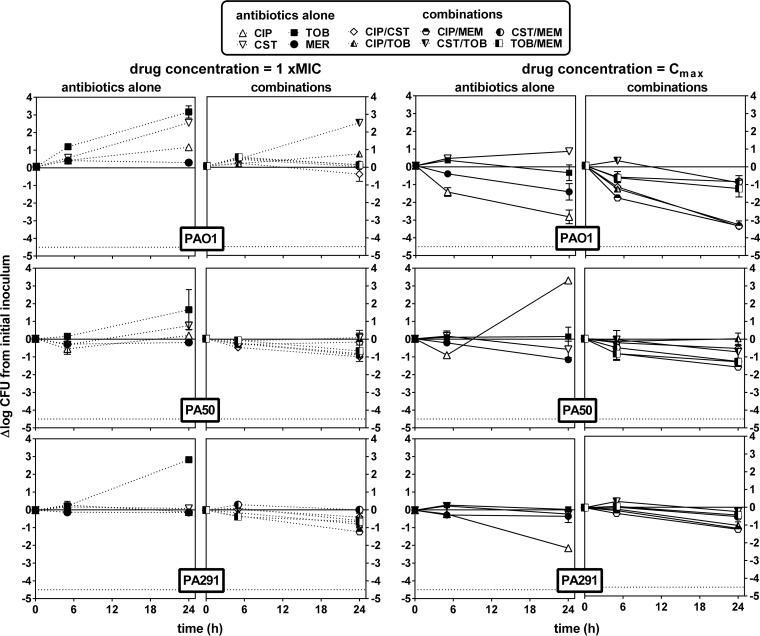
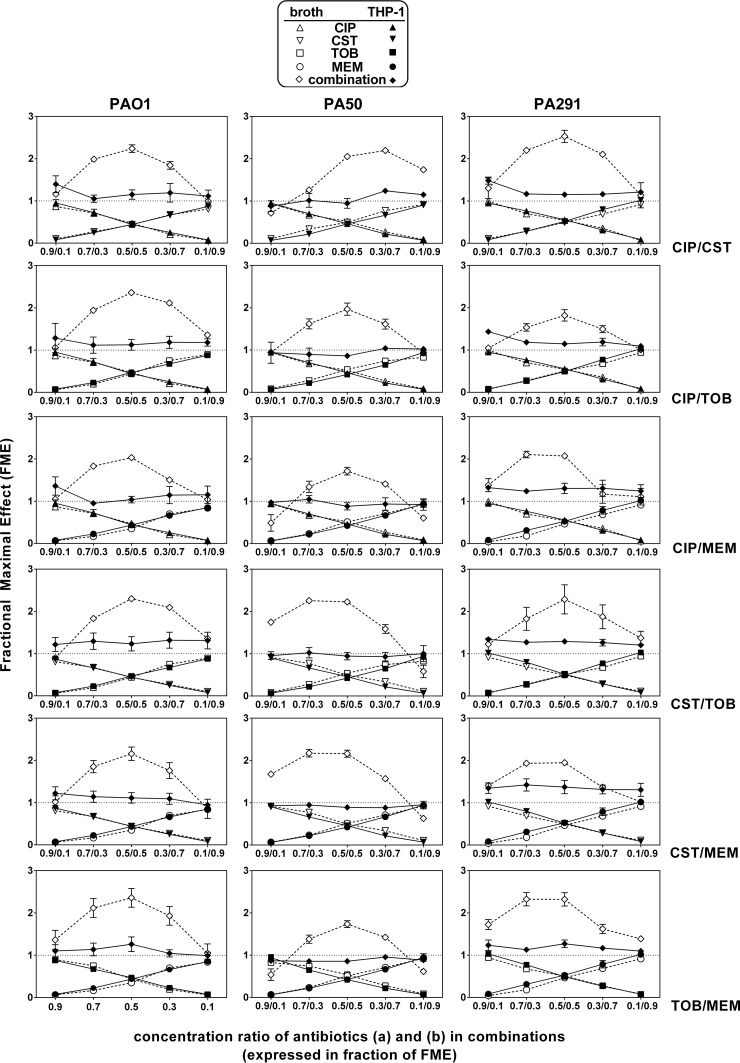
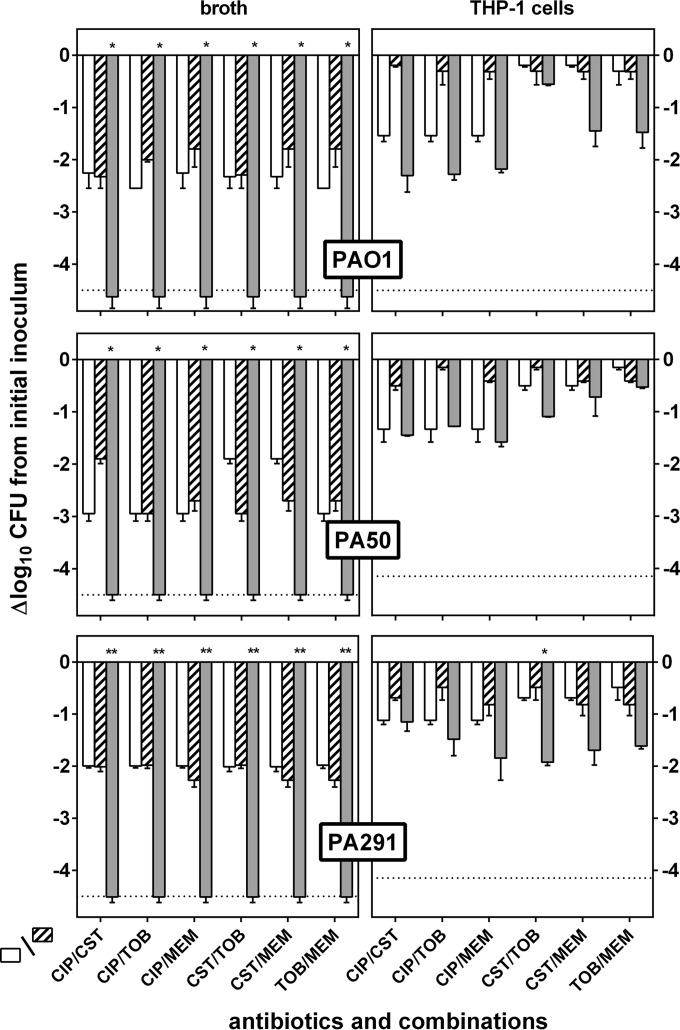
Antibiotic combinations are often used for treating Pseudomonas aeruginosa infections but their efficacy toward intracellular bacteria has not been investigated so far. We have studied combinations of representatives of the main antipseudomonal classes (ciprofloxacin, meropenem, tobramycin, and colistin) against intracellular P. aeruginosa in a model of THP-1 monocytes in comparison with bacteria growing in broth, using the reference strain PAO1 and two clinical isolates (resistant to ciprofloxacin and meropenem, respectively). Interaction between drugs was assessed by checkerboard titration (extracellular model only), by kill curves, and by using the fractional maximal effect (FME) method, which allows studying the effects of combinations when dose-effect relationships are not linear. For drugs used alone, simple sigmoidal functions could be fitted to all concentration-effect relationships (extracellular and intracellular bacteria), with static concentrations close to (ciprofloxacin, colistin, and meropenem) or slightly higher than (tobramycin) the MIC and with maximal efficacy reaching the limit of detection in broth but only a 1 to 1.5 (colistin, meropenem, and tobramycin) to 2 to 3 (ciprofloxacin) log10 CFU decrease intracellularly. Extracellularly, all combinations proved additive by checkerboard titration but synergistic using the FME method and more bactericidal in kill curve assays. Intracellularly, all combinations proved additive only based on both FME and kill curve assays. Thus, although combinations appeared to modestly improve antibiotic activity against intracellular P. aeruginosa, they do not allow eradication of these persistent forms of infections. Combinations including ciprofloxacin were the most active (even against the ciprofloxacin-resistant strain), which is probably related to the fact this drug was the most effective alone intracellularly.
Copyright © 2015, American Society for Microbiology. All Rights Reserved.
Figures
Similar articles
-
Activity of meropenem with and without ciprofloxacin and colistin against Pseudomonas aeruginosa and Acinetobacter baumannii.Antimicrob Agents Chemother. 2008 Jan;52(1):333-6. doi: 10.1128/AAC.00689-07. Epub 2007 Oct 29. Antimicrob Agents Chemother. 2008. PMID: 17967915 Free PMC article.
-
Synergistic activities of ceftazidime-avibactam in combination with different antibiotics against colistin-nonsusceptible clinical strains of Pseudomonas aeruginosa.Infect Dis (Lond). 2020 Sep;52(9):616-624. doi: 10.1080/23744235.2020.1767803. Epub 2020 May 19. Infect Dis (Lond). 2020. PMID: 32427010
-
Colistin plus meropenem combination is synergistic in vitro against extensively drug-resistant Pseudomonas aeruginosa, including high-risk clones.J Glob Antimicrob Resist. 2019 Sep;18:37-44. doi: 10.1016/j.jgar.2019.04.012. Epub 2019 May 30. J Glob Antimicrob Resist. 2019. PMID: 31154007
-
Investigation of synergism of meropenem and ciprofloxacin against Pseudomonas aeruginosa and Acinetobacter strains isolated from intensive care unit infections.Scand J Infect Dis. 2001;33(11):818-21. doi: 10.1080/00365540110027222. Scand J Infect Dis. 2001. PMID: 11760161
-
In vitro activities of non-traditional antimicrobials alone or in combination against multidrug-resistant strains of Pseudomonas aeruginosa and Acinetobacter baumannii isolated from intensive care units.Int J Antimicrob Agents. 2006 Mar;27(3):224-8. doi: 10.1016/j.ijantimicag.2005.10.012. Epub 2006 Feb 7. Int J Antimicrob Agents. 2006. PMID: 16464562
Cited by
-
The Impact of Pseudomonas aeruginosa Infection in Adult Cystic Fibrosis Patients-A Single Polish Centre Study.Pathogens. 2023 Dec 12;12(12):1440. doi: 10.3390/pathogens12121440. Pathogens. 2023. PMID: 38133323 Free PMC article.
-
Drug Combination of Ciprofloxacin and Polymyxin B for the Treatment of Multidrug-Resistant Acinetobacter baumannii Infections: A Drug Pair Limiting the Development of Resistance.Pharmaceutics. 2023 Feb 21;15(3):720. doi: 10.3390/pharmaceutics15030720. Pharmaceutics. 2023. PMID: 36986580 Free PMC article.
-
Quantifying combined effects of colistin and ciprofloxacin against Escherichia coli in an in silico pharmacokinetic-pharmacodynamic model.Sci Rep. 2024 May 22;14(1):11706. doi: 10.1038/s41598-024-61518-0. Sci Rep. 2024. PMID: 38778123 Free PMC article.
-
Simultaneous Particle Size Reduction and Homogeneous Mixing to Produce Combinational Powder Formulations for Inhalation by the Single-Step Co-Jet Milling.J Pharm Sci. 2019 Sep;108(9):3146-3151. doi: 10.1016/j.xphs.2019.05.011. Epub 2019 May 18. J Pharm Sci. 2019. PMID: 31112716 Free PMC article.
-
RX-P873, a Novel Protein Synthesis Inhibitor, Accumulates in Human THP-1 Monocytes and Is Active against Intracellular Infections by Gram-Positive (Staphylococcus aureus) and Gram-Negative (Pseudomonas aeruginosa) Bacteria.Antimicrob Agents Chemother. 2015 Aug;59(8):4750-8. doi: 10.1128/AAC.00428-15. Epub 2015 May 26. Antimicrob Agents Chemother. 2015. PMID: 26014952 Free PMC article.
References
Publication types
MeSH terms
Substances
LinkOut - more resources
Full Text Sources
Other Literature Sources
Medical
