

Capturing multidimensionality in stroke aphasia: mapping principal behavioural components to neural structures
- PMID: 25348632
- PMCID: PMC4240295
- DOI: 10.1093/brain/awu286
Capturing multidimensionality in stroke aphasia: mapping principal behavioural components to neural structures
Abstract
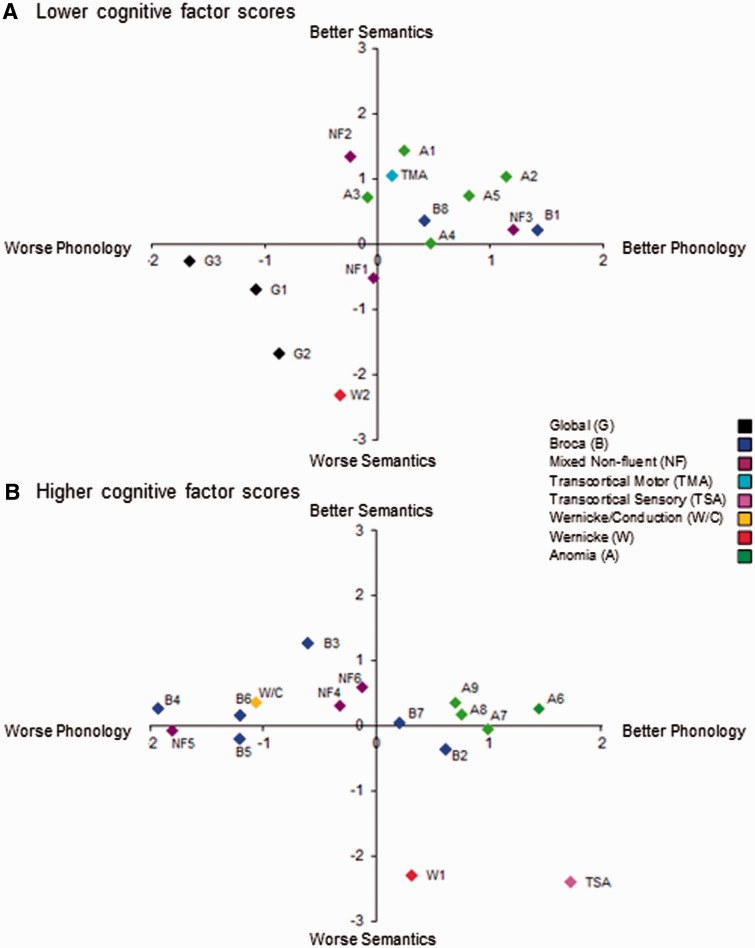
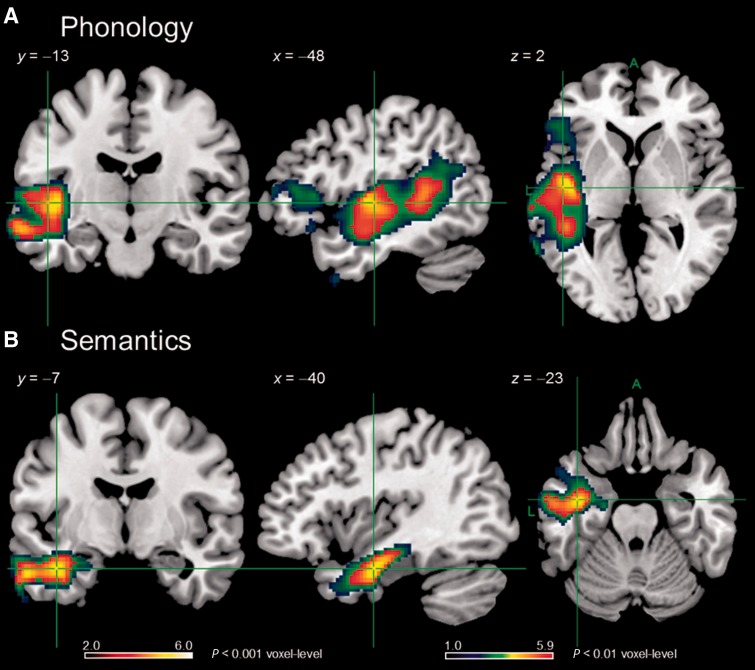
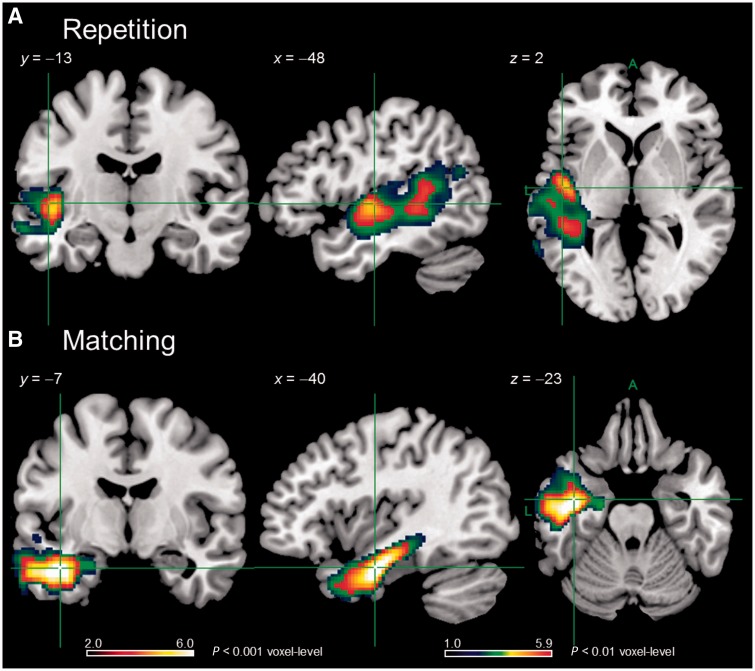
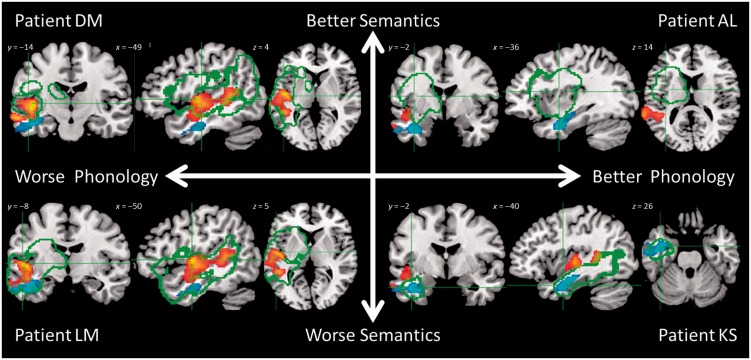
Stroke aphasia is a multidimensional disorder in which patient profiles reflect variation along multiple behavioural continua. We present a novel approach to separating the principal aspects of chronic aphasic performance and isolating their neural bases. Principal components analysis was used to extract core factors underlying performance of 31 participants with chronic stroke aphasia on a large, detailed battery of behavioural assessments. The rotated principle components analysis revealed three key factors, which we labelled as phonology, semantic and executive/cognition on the basis of the common elements in the tests that loaded most strongly on each component. The phonology factor explained the most variance, followed by the semantic factor and then the executive-cognition factor. The use of principle components analysis rendered participants' scores on these three factors orthogonal and therefore ideal for use as simultaneous continuous predictors in a voxel-based correlational methodology analysis of high resolution structural scans. Phonological processing ability was uniquely related to left posterior perisylvian regions including Heschl's gyrus, posterior middle and superior temporal gyri and superior temporal sulcus, as well as the white matter underlying the posterior superior temporal gyrus. The semantic factor was uniquely related to left anterior middle temporal gyrus and the underlying temporal stem. The executive-cognition factor was not correlated selectively with the structural integrity of any particular region, as might be expected in light of the widely-distributed and multi-functional nature of the regions that support executive functions. The identified phonological and semantic areas align well with those highlighted by other methodologies such as functional neuroimaging and neurostimulation. The use of principle components analysis allowed us to characterize the neural bases of participants' behavioural performance more robustly and selectively than the use of raw assessment scores or diagnostic classifications because principle components analysis extracts statistically unique, orthogonal behavioural components of interest. As such, in addition to improving our understanding of lesion-symptom mapping in stroke aphasia, the same approach could be used to clarify brain-behaviour relationships in other neurological disorders.
Keywords: aphasia; language processing; lesion symptom mapping; phonology; semantics.
© The Author (2014). Published by Oxford University Press on behalf of the Guarantors of Brain.
Figures
Comment in
-
Stroke: improved lesion-symptom mapping in poststroke aphasia.Nat Rev Neurol. 2014 Dec;10(12):674. doi: 10.1038/nrneurol.2014.217. Epub 2014 Nov 11. Nat Rev Neurol. 2014. PMID: 25385335 No abstract available.
References
-
- Adlam ALR, Patterson K, Rogers TT, Nestor PJ, Salmond CH, Acosta-Cabronero J, et al. Semantic dementia and fluent primary progressive aphasia: two sides of the same coin? Brain. 2006;129:3066–80. - PubMed
-
- Ardila A. The role of insula in language: an unsettled question. Aphasiology. 1999;13:79–87.
-
- Ashburner J. Friston KJ. Voxel-based morphometry – The methods. NeuroImage. 2000;11:805–21. - PubMed
Publication types
MeSH terms
Grants and funding
LinkOut - more resources
Full Text Sources
Other Literature Sources
Medical
Research Materials
