. 2015 Jan;35(1):211-23.
doi: 10.1128/MCB.01054-14. Epub 2014 Oct 27.

Dynamics of mitochondrial DNA nucleoids regulated by mitochondrial fission is essential for maintenance of homogeneously active mitochondria during neonatal heart development

Affiliations

Dynamics of mitochondrial DNA nucleoids regulated by mitochondrial fission is essential for maintenance of homogeneously active mitochondria during neonatal heart development

Takaya Ishihara et al. Mol Cell Biol. 2015 Jan.

Abstract

Mitochondria are dynamic organelles, and their fusion and fission regulate cellular signaling, development, and mitochondrial homeostasis, including mitochondrial DNA (mtDNA) distribution. Cardiac myocytes have a specialized cytoplasmic structure where large mitochondria are aligned into tightly packed myofibril bundles; however, recent studies have revealed that mitochondrial dynamics also plays an important role in the formation and maintenance of cardiomyocytes. Here, we precisely analyzed the role of mitochondrial fission in vivo. The mitochondrial fission GTPase, Drp1, is highly expressed in the developing neonatal heart, and muscle-specific Drp1 knockout (Drp1-KO) mice showed neonatal lethality due to dilated cardiomyopathy. The Drp1 ablation in heart and primary cultured cardiomyocytes resulted in severe mtDNA nucleoid clustering and led to mosaic deficiency of mitochondrial respiration. The functional and structural alteration of mitochondria also led to immature myofibril assembly and defective cardiomyocyte hypertrophy. Thus, the dynamics of mtDNA nucleoids regulated by mitochondrial fission is required for neonatal cardiomyocyte development by promoting homogeneous distribution of active mitochondria throughout the cardiomyocytes.


Figures

FIG 1
FIG 1
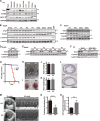
Expression profiles of Drp1 and the phenotypes of muscle-specific (MS) Drp1-KO mice. (A) Immunoblot analysis of various tissues from a P7 control mouse. (B and C) Immunoblot analysis of heart protein samples from control mice at various developmental stages. (D and E) Deletion efficiency of Drp1 during embryonic (D) and postnatal (E) stages. (F) Immunoblot analysis of heart and hind limb protein samples at P7 from MS-Drp1-KO mice and a littermate control. (G) Survival curves of MS-Drp1-KO and control mice. (H and I) Images of P7 mice (H) and their hearts (I). (J and K) Mean weight of whole bodies (J) and the hearts (K) of P7 mice in control (n = 9) and MS-Drp1-KO (n = 5) mice. (L) Hematoxylin-eosin staining of a cryosection from a P7 heart. (M) Representative echocardiographic analysis showing B-mode and M-mode images. (N and O) Left ventricle fractional shortening (N) and left ventricular end-systolic diameter dimension (O) quantified by echocardiographic tracing in MS-Drp1-KO (n = 4) and control (n = 6) mice. Data are presented as the means ± standard deviations for all graphs. **, P < 0.01, and ***, P < 0.001, for KO compared with control. Molecular mass markers (kDa) are indicated to the right in panels A to F. Summarized echocardiographic measurement data are also shown in Table 1.
FIG 2
FIG 2
Myofibril disorganization in the Drp1-KO heart. (A) Cardiomyocytes of control and MS-Drp1-KO mice during cardiac development were observed by electron microscopy. Middle panels show the distribution of nuclei (blue), mitochondria (green), and myofibrils (orange). (B) Magnified images of cardiomyocytes of control and MS-Drp1-KO mice at P7 observed by electron microscopy. Red arrowheads indicate disorganized sarcomeres, and blue arrowheads indicate SR structures. (C) Actin filaments were stained with rhodamine-phalloidin in cryosections from a P7 control and Drp1-KO heart and then were observed by confocal microscopy. (D) Cell proliferation was examined by immunostaining with Ki-67. The graph indicates the ratio of Ki-67-positive cells in the cross section. P3, control, n = 8; MS-Drp1-KO, n = 5; P7, control, n = 5; MS-Drp1-KO, n = 6. (E) Cell death in the P7 heart was evaluated by immunostaining with cleaved caspase-3. The graph indicates the ratio of cleaved caspase-3-positive-cells in the cross section. Control, n = 5; MS-Drp1-KO, n = 8. (F and G) Immunoblot analysis of mitochondrial biogenesis (F) and mitochondrial autophagy (G) in hearts from P7 control and Drp1-KO mice. Data are presented as the means ± standard deviations for all graphs. *, P < 0.05 for KO compared with control. Molecular mass markers (kDa) are indicated to the right in panels F and G.
FIG 3
FIG 3
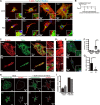
Mitochondrial respiratory defect in Drp1-KO heart. (A) Histochemical staining for mitochondrial cytochrome c oxidase (COX) activity and succinate dehydrogenase (SDH) activity in heart samples from P7 mice. (B) ImageJ analysis was used to define the threshold and to measure the COX activity-positive area. Control, n = 6; MS-Drp1-KO, n = 6. (C) ADP-driven oxygen consumption by the isolated P7 mouse heart mitochondrial fraction. TMPD, N,N,N′,N′-tetramethyl-p-phenylenediamine. Control, n = 5; MS-Drp1-KO, n = 7. (D) mtDNA content quantified by qPCR, shown as the relative ratio of mtDNA to nDNA. Dashed horizontal bars are presented as means. (E) Immunoblot analysis of several respiratory subunits in heart samples from P5 and P7 mice. (F) Protein levels of respiratory chain subunits were quantified by ImageQuant TL. Four independent experiments with two littermate control and MS-Drp1-KO mouse hearts were performed. (G) RT-PCR analysis of the heart to determine mRNAs encoded by mtDNA and the nuclear genome. NTC, no-template negative control. Glyceraldehyde-3-phosphate dehydrogenase (GAPDH) was used to standardize reaction conditions and cDNA expression levels. Data are presented as the means ± standard deviations for all graphs. *, P < 0.05; **, P < 0.01; ***, P < 0.001.
FIG 4
FIG 4
Heterogeneity of respiration and mtDNA nucleoid distribution in Drp1-KO heart. (A) Electron microscopic analysis of COX activity in P7 control and MS-Drp1-KO heart sections. Arrows indicate mitochondria retaining COX activity, and arrowheads indicate COX-deficient mitochondria. (B) Anti-DNA (green) immunofluorescence staining of mtDNA nucleoids in cryosections from P7 control and MS-Drp1-KO mouse hearts observed by confocal microscopy. Nuclei were stained with Hoechst stain (blue). (C) Mitochondrial heterogeneity was confirmed by triple staining with nucleoid-specific stain (green), nuclear genome-encoded Tom20 (blue), and mtDNA-encoded respiratory subunit COX1 (red). Arrows indicate COX1-stained mitochondria that are accumulating, accompanied by nucleoid clustering. Arrowheads indicate Tom20-positive mitochondria with less COX1 staining.
FIG 5
FIG 5
Suppression of hypertrophic growth and sarcomere formation in Drp1-KO cardiomyocytes. (A) Primary cultured cardiomyocytes from control mice and MS-Drp1-KO mice were cultured for 1, 2, 3, or 4 days and stained with anti-cytochrome c (green), rhodamine-phalloidin (red), and Hoechst stain (blue) and then observed by confocal microscopy. (B) Schematic diagram for the time course of the experiment (C to G). (C) Primary cultured cardiomyocytes from control and MS-Drp1-KO mice were cultured for 4 days, stained with anti-cytochrome c (green) and rhodamine-phalloidin (red), and then observed by confocal microscopy. (D) Magnified images showing the sarcomere structures. (E) Z lines immunostained by anti-α-actinin. (F and G) Cell surface area and Z line number measurement were calculated using Zeiss Zen 2010LSM software. (F) Box-and-whisker plots of the cardiomyocyte surface area after culturing for 1 or 4 days. (G) Quantification of Z line number in cardiomyocytes after culturing for 4 days. (H and I) Representative image of staining with fluorescent dye mitoSOX to monitor mitochondrial ROS, with counterstaining by MitoTracker DeepRed 633 (H). Rotenone was used as the positive control. The fluorescence ratio of the mitoSOX was quantified by confocal microscopy (I). Data are presented as the means ± standard deviations for bar graphs. ***, P < 0.001.
FIG 6
FIG 6
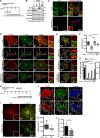
Regulation of hypertrophic growth and sarcomere formation through mitochondrial dynamics in primary cultured cardiomyocytes. (A) Schematic diagram for time course of experiment (D to G). (B and C) Confirmation of knockdown efficiency in isolated cells from heart by immunoblotting (B) and immunofluorescence staining (C). Molecular mass markers (kDa) are indicated to the right in panel B. (D to G) Primary cultured cardiomyocytes were treated with siRNA against Drp1, Mfn1/Mfn2, or Drp1/Mfn1/Mfn2 for 3 days and then stained as indicated. Confocal images are shown in panels D and E. Quantification of cardiomyocyte surface area (F) and matured Z line (left axis) and measurement of small Z body number (right axis) (G) were done using Zeiss ZEN 2010LSM software. (H) Schematic for the time course of the experiment (J to L). Grown primary cultured cardiomyocytes were treated for 3 days with siRNA against Drp1 and then stained as indicated. (I) Confirmation of knockdown efficiency in cardiomyocytes by immunofluorescence staining. (J) Confocal images were triple stained with anti-Tom20 (green), rhodamine-phalloidin (red), and anti-α-actinin (blue). (K) Full-grown cardiomyocyte surface area quantified as described for panel F. (L) Matured Z line quantified as described for panel G. Data are presented as the means ± standard deviations for bar graphs. *, P < 0.05; **, P < 0.01; ***, P < 0.001.
FIG 7
FIG 7
mtDNA nucleoid clustering accompanied by heterogeneity in COX activity in Drp1-KO cardiomyocytes. (A) Primary cultured cardiomyocytes stained with anti-DNA antibody (green), anti-Tom20 (blue), and anti-COX1 (red). (B) Primary cultured cardiomyocytes stained by anti-DNA antibody (green) and anti-Tom20 (red) and COX activity visualized by 3,3′-diaminobenzidine (brown).

Similar articles

Cited by

References

    1. Ishihara N, Otera H, Oka T, Mihara K. 2013. Regulation and physiologic functions of GTPases in mitochondrial fusion and fission in mammals. Antioxid Redox Signal 19:389–399. doi:10.1089/ars.2012.4830. - DOI - PubMed
    1. McBride HM, Neuspiel M, Wasiak S. 2006. Mitochondria: more than just a powerhouse. Curr Biol 16:R551–R560. doi:10.1016/j.cub.2006.06.054. - DOI - PubMed
    1. Nunnari J, Suomalainen A. 2012. Mitochondria: in sickness and in health. Cell 148:1145–1159. doi:10.1016/j.cell.2012.02.035. - DOI - PMC - PubMed
    1. Chen H, Chomyn A, Chan DC. 2005. Disruption of fusion results in mitochondrial heterogeneity and dysfunction. J Biol Chem 280:26185–26192. doi:10.1074/jbc.M503062200. - DOI - PubMed
    1. Chen H, McCaffery JM, Chan DC. 2007. Mitochondrial fusion protects against neurodegeneration in the cerebellum. Cell 130:548–562. doi:10.1016/j.cell.2007.06.026. - DOI - PubMed

Publication types

MeSH terms

LinkOut - more resources