. 2014 Oct 28:14:287.
doi: 10.1186/s12870-014-0287-2.

Analysis of wild-species introgressions in tomato inbreds uncovers ancestral origins

Analysis of wild-species introgressions in tomato inbreds uncovers ancestral origins

Naama Menda et al. BMC Plant Biol. .

Abstract

Background: Decades of intensive tomato breeding using wild-species germplasm have resulted in the genomes of domesticated germplasm (Solanum lycopersicum) being intertwined with introgressions from their wild relatives. Comparative analysis of genomes among cultivated tomatoes and wild species that have contributed genetic variation can help identify desirable genes, such as those conferring disease resistance. The ability to identify introgression position, borders, and contents can reveal ancestral origins and facilitate harnessing of wild variation in crop breeding.

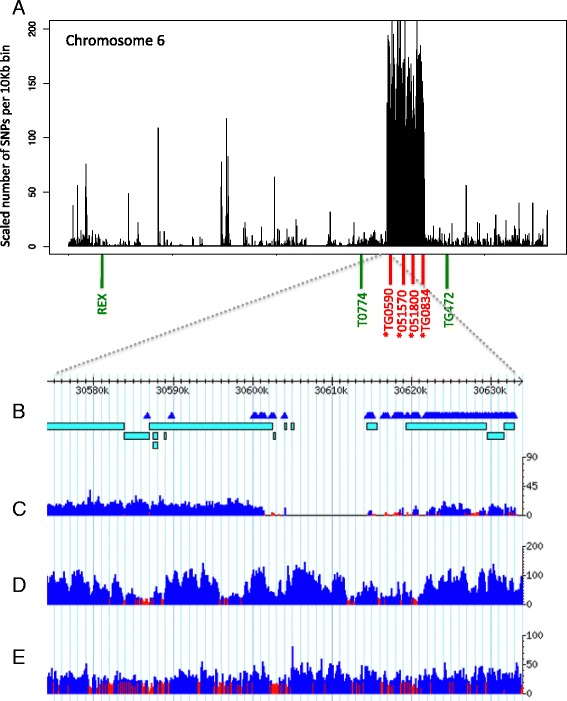
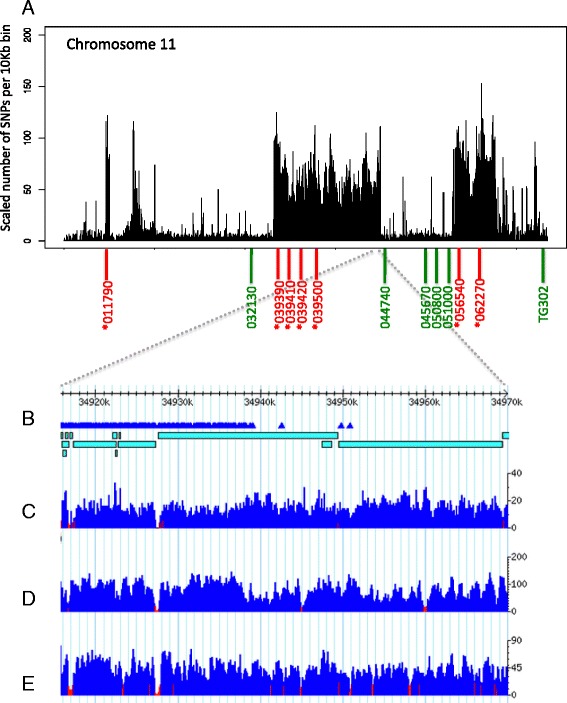
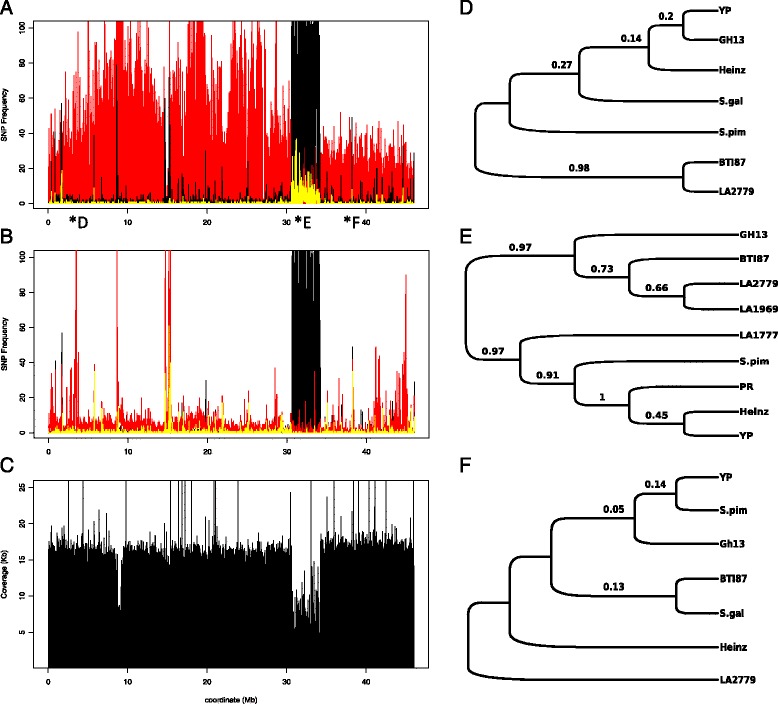
Results: Here we present the whole-genome sequences of two tomato inbreds, Gh13 and BTI-87, both carrying the begomovirus resistance locus Ty-3 introgressed from wild tomato species. Introgressions of different sizes on chromosome 6 of Gh13 and BTI-87, both corresponding to the Ty-3 region, were identified as from a source close to the wild species S. chilense. Other introgressions were identified throughout the genomes of the inbreds and showed major differences in the breeding pedigrees of the two lines. Interestingly, additional large introgressions from the close tomato relative S. pimpinellifolium were identified in both lines. Some of the polymorphic regions were attributed to introgressions in the reference Heinz 1706 genome, indicating wild genome sequences in the reference tomato genome.

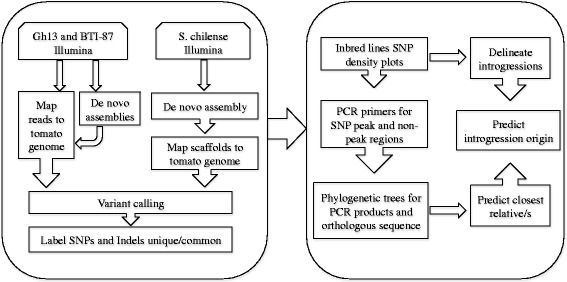
Conclusions: The methods developed in this work can be used to delineate genome introgressions, and subsequently contribute to development of molecular markers to aid phenotypic selection, fine mapping and discovery of candidate genes for important phenotypes, and for identification of novel variation for tomato improvement. These universal methods can easily be applied to other crop plants.


Figures

Figure 1
Figure 1
Schematic view of the genome assembly and the introgression detection pipelines.
Figure 2
Figure 2
SNP density and coverage plots for chromosome 6. A) SNP density plot of the Gh13 chromosome 6. Peak region on chromosome 6 around 30.6 Mb–34.24 Mb. (*) Denotes PCR markers within the SNP peak region. B) Visualization of the 50-Kb region around the beginning of the SNP peak region (30.58–30.63 Mb). SNP marks are denoted in triangles. Bars represent de novo scaffolds of Gh13. C) Illumina coverage plot of the Gh13 genome mapped to the reference H1706 genome D) coverage of the H1706 genome E) coverage of the S. pimpinellifolium genome. Y axes for plots C-E represent number of Illumina reads mapped in that region.
Figure 3
Figure 3
SNP density and coverage plots for chromosome 11. A) SNP density plot of the Gh13 chromosome 11. (*) Denotes PCR markers within the three assayed SNP peak regions (4.58–5.01 Mb, 23.12–34.94 Mb, 42.89–47.79 Mb). B) Visualization of the 50-Kb region around the end of the largest SNP peak region (34.92–34.97 Mb). SNP marks are denoted in triangles. Bars represent de novo scaffolds of Gh13. C) Illumina coverage plot of the Gh13 genome mapped to the reference H1706 genome D) coverage of the H1706 genome E) coverage of the S. pimpinellifolium genome. Y axes for plots C-E represent the number of Illumina reads mapped in that region.
Figure 4
Figure 4
Chromosome 6 SNPs and gene trees of line Gh13 compared to selected tomato wild species and accessions. A) Chromosome 6 SNP plots of inbred line Gh13 (black) and S. pimpinellifolium (red) compared to H1706. Shared SNPs are denoted in yellow. B) Chromososme 6 SNP plots of inbred line Gh13 (black) and heirloom line YP (red) compared to H1706. Shared SNPs are denoted in yellow. C) Coverage plot of chromosome 6 of Gh13. D) Gene tree of non-peak region (marker REX). E) Gene tree of SNP peak region (marker TG590). F) Gene tree of non-peak region (marker TG472).
Figure 5
Figure 5
Chromosome 11 SNPs and gene trees of line Gh13 compared to selected tomato wild species and accessions. A) Chromosome 11 SNP plots of inbred line Gh13 (black) and S. pimpinellifolium (red) compared to H1706. Shared SNPs are denoted in yellow. B) Chromosome 11 SNP plots of inbred line Gh13 (black) and heirloom line YP (red) compared to H1706. Shared SNPs are denoted in yellow. C) Coverage plot of chromosome 11 of Gh13. Gene trees of three regions from chromosome 11. D) Gene tree of SNP peak region (marker P11-039390). E) Gene tree of nonpeak region (marker P11-050800). F) Gene tree of SNP-peak region (marker P11-062270).
Figure 6
Figure 6
Genome regions of the Ty-3 introgression in lines Gh13 and BTI-87. A) Genome coverage plot of the chromosome 6 introgression (Gh13 and BTI-87). B) Zooming in an 80-Kb region from Figure 5A, spanning the Ty-3 region.

References

    1. Giovannoni JJ. Fruit ripening mutants yield insights into ripening control. Curr Opin Plant Biol. 2007;10(3):283–289. doi: 10.1016/j.pbi.2007.04.008. - DOI - PubMed
    1. Pedley KF, Martin GB. Molecular basis of Pto-mediated resistance to bacterial speck disease in tomato. Annu Rev Phytopathol. 2003;41:215–243. doi: 10.1146/annurev.phyto.41.121602.143032. - DOI - PubMed
    1. Scofield SR, Tobias CM, Rathjen JP, Chang JH, Lavelle DT, Michelmore RW, Staskawicz BJ. Molecular basis of gene-for-gene specificity in bacterial speck disease of tomato. Science. 1996;274(5295):2063–2065. doi: 10.1126/science.274.5295.2063. - DOI - PubMed
    1. Blanca J, Canizares J, Cordero L, Pascual L, Jose Diez M, Nuez F. Variation revealed by SNP genotyping and morphology provides insight into the origin of the tomato. PLoS One. 2012;7(10):e48198. doi: 10.1371/journal.pone.0048198. - DOI - PMC - PubMed
    1. Sim S, Robbins M, Van Deynze A, Michel A, Francis D. Population structure and genetic differentiation associated with breeding history and selection in tomato (Solanum lycopersicum L.) Heredity. 2010;106(6):927–935. doi: 10.1038/hdy.2010.139. - DOI - PMC - PubMed

Publication types

Associated data