. 2015 Apr;30(4):596-605.
doi: 10.1002/jbmr.2389.

Deletion of connexin43 in osteoblasts/osteocytes leads to impaired muscle formation in mice

Affiliations

Deletion of connexin43 in osteoblasts/osteocytes leads to impaired muscle formation in mice

Hua Shen et al. J Bone Miner Res. 2015 Apr.

Abstract

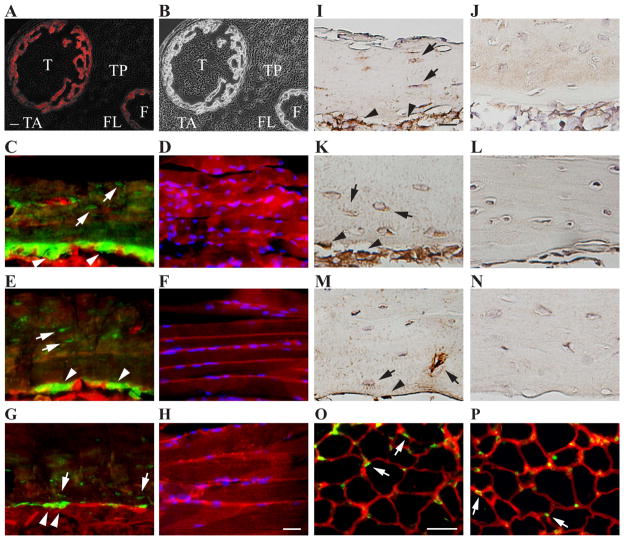
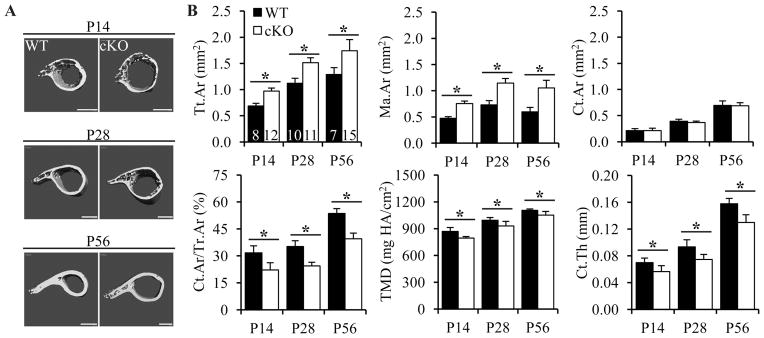
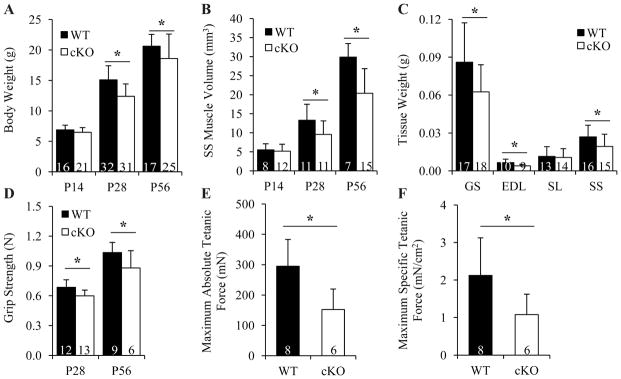
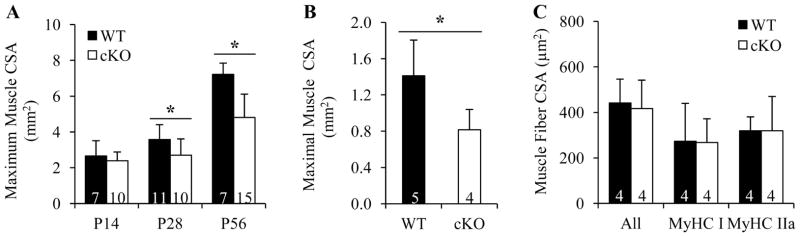
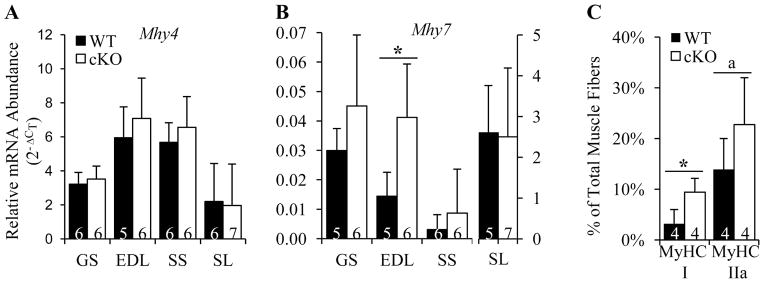
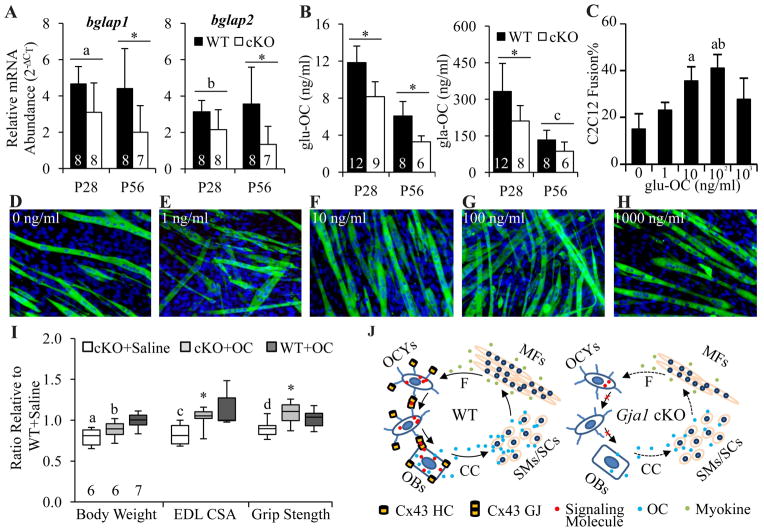
It is well-established that muscle forces are necessary for bone development as well as proper bone modeling and remodeling. Recent work has also suggested that bone acts as an endocrine organ that can influence the development of other organs. Connexin43 (Cx43), a gap junction protein that transduces mechanical signals, is an important determinant of cortical bone modeling. Using an osteoblast/osteocyte-specific ablation of the Cx43 gene (Gja1) driven by the 2.3-kb Col1 α1 promoter (cKO) in the mouse, in this study we confirmed reduced cortical bone thickness and density with expanded bone marrow cavity in the cKO humerus. Surprisingly, Gja1 deletion in bone cells also affected skeletal muscle development, resulting in lower fast muscle weight, grip strength, and maximum absolute and specific tetanic forces (60% to 80%, 85%, and 50%, respectively, of WT mice). The normally fast twitch extensor digitorum longus (EDL) muscle exhibited increased slow twitch fibers in cKO mice. These muscle defects were accompanied by a 40% to 60% reduction in mRNA abundance for genes encoding osteocalcin in the humerus, relative to WT mice. Accordingly, both carboxylated and undercarboxylated isoforms of osteocalcin were reduced by over 30% in the circulation of cKO mice. Moreover, the active, undercarboxylated isoform of osteocalcin (glu-OC) promoted myotube formation in C2C12 myoblast cultures, and glu-OC injections to cKO mice rescued EDL muscle cross-sectional area and grip strength in vivo. These findings demonstrate that Cx43 in osteoblasts/osteocytes indirectly modulates skeletal muscle growth and function, potentially via an endocrine effect of glu-OC.

Keywords: BONE-MUSCLE INTERACTIONS; CONNEXIN43; GAP JUNCTION; OSTEOCALCIN.


Figures

Fig. 1
Fig. 1
Selective deletion of Cx43 gene Gja1 from OBs/OCYs. A and B, Representative fluorescence plus phase contrast (A) and phase contrast (B) images from lower hindlimb transverse section of P1.5 Col1Cre;Ai14 mice. Col1Cre (in red) was detected in the tibia (T) and fibula (F) bones but not in the nearby tibia anterior (TA), tibia posterior (TP), and fibula longus (FL) muscles. Bar, 50 μm. N = 2. CH, Representative fluorescence images of humeral diaphysis (C, E, G) and SS muscle (D, F, H) from coronal sections of P14 (C and D), P28 (E and F), and P56 (G and H) Col1Cre;mTmG mouse shoulders. Col1Cre (in green) was detected in OCYs (white arrows) and OBs (white arrow heads) but not in SS muscles counterstained with DAPI (in blue). N = 3 at each time point. Bar, 100 μm. IN, Representative images of Cx43 immunohistochemistry staining (in dark brown) on the coronal sections of humeral diaphysis of WT (I, K, M) and Gja1 cKO (J, L, N) mice at P14 (I and J), P28 (K and L), and P56 (M and N). Bar, 50 μm. N = 3 for each condition. O and P, Representative immunofluorescence staining for Cx43 expression (in green) on the transverse sections of P28 EDL muscle from WT (O) and Gja1 cKO (P) mice. Cx43 positive signals (white arrows) were detected at the junctions of neighboring muscle fibers (labeled in red with WGA) in both WT and cKO muscles. Bar, 25 μm. N = 3 and 4 for O and P, respectively.
Fig. 2
Fig. 2
Cx43 deficiency in OBs/OCYs altered cortical bone microarchitecture. A and B, Representative 3D microCT images (A) and analyses of cortical bone indexes (B) at the mid-diaphysis of WT and Gja1 cKO humeri. Bars, 500 μm in A. p < 0.001 for both genotype and age for all indexes, except for Ct.Ar, where p = 0.493 for genotype, 2-way ANOVA followed by Tukey’s test. The sample sizes for A and B are indicated in the first plot of B. *, p < 0.05.
Fig. 3
Fig. 3
Cx43 deficiency in OBs/OCYs led to defects in muscle mass and strength accrual. A, Changes in mouse body weights. p < 0.001 for both genotype and age, 2-way ANOVA followed by Tukey’s test. B, Changes in SS muscle volumes. p < 0.001 for both genotype and age, 2-way ANOVA followed by Tukey’s test. C, Comparison of wet muscle weights between P28 WT and cKO mice. p = 0.014, 0.026, 0.777, and 0.039 for GS, EDL, SL, and SS muscle, t-test. D, Changes in mouse forelimb grip strength. p < 0.001 for both genotype and age, 2-way ANOVA followed by Tukey’s test. E and F, Comparison of maximum absolute (E) and specific (F) tetanic forces of GS muscles between P28 WT and Gja1 cKO mice. p = 0.012 and 0.040 for E and F, respectively, t-test. Sample sizes are indicated at the bottom of each column plot. *, p < 0.05.
Fig. 4
Fig. 4
Cx43 deficiency in OBs/OCYs reduced muscle but not muscle fiber CSA. A and B, Maximum whole muscle CSA of SS (A) and EDL (B) muscle determined by microCT. p = 0.563, 0.048, and <0.001 at P14, P28, and P56 in A, 2-way ANOVA followed by Tukey’s test; p = 0.032 in B, t-test. C, Average CSAs of all, MyHC I, and MyHC IIa fibers evaluated by immunofluorescence staining. p = 0.772, 0.963, and 0.999, respectively, t-test. Sample sizes are indicated at the bottom of each column. *, p < 0.05.
Fig. 5
Fig. 5
Cx43 deficiency in OBs/OCYs altered muscle fiber composition. A and B, Changes in mRNA expression of Mhy4 (A) and Mhy7 (B) in P28 mouse skeletal muscles. p = 0.496, 0.406, 0.335, and 0.857 for GS, EDL, SS, and SL muscle, respectively in A; p = 0.655, 0.014, 0.411, and 0.911 for GS, EDL, SS, and SL muscle, respectively in B, t-test. C, Changes in the composition of MyHC I and MyHC IIa fibers in P28 EDL muscles. *, p = 0.019, a, p = 0.161, t-test. Sample sizes are indicated at the bottom of each column.
Fig. 6
Fig. 6
Bone Gja1 deletion led to a decrease in osteoblastic osteocalcin, which is also myogenic. A, Relative abundance of bglap1 and bglap2 mRNA in humeri of WT and Gja1 cKO mice. bglap1, p = 0.002 and 0.264 for genotype and age; bglap2, p = 0.002 and 0.688 for genotype and age; a, p = 0.065, b, p = 0.144, *, p < 0.05, two-way ANOVA followed by Tukey’s test. B, Changes in plasma glu-OC and gla-OC in WT and Gja1 cKO mice. glu-OC, p < 0.001 for both genotype and age; gla-OC, p = 0.006 and <0.001 for genotype and age; c, p = 0.292, *, p < 0.05, 2-way ANOVA followed by Tukey’s test. Sample sizes for A and B are indicated at the bottom of each column plot. C–H, Representative fluorescence images (D–H) and quantifications (C) for the effects of glu-OC on C2C12 myoblast differentiation. C2C12 differentiation was induced in the presence of 0 (D), 1 (E), 10 (F), 100 (G), and 1000 (H) ng/ml of glu-OC for 72 h. The culture was stained with MF20 antibody and Bisbenzimide H33258 for sarcomere myosin (in green) and nuclei (in blue), respectively. Bar, 50 μm. Three independent experiments were performed for each treatment. p = 0.005 for glu-OC concentration; a, p < 0.05 compared to 0; b, p < 0.05 compared to 1; one-way ANOVA followed by Tukey’s test. I, Changes in body weight, maximum EDL muscle CSA, and grip strength in P28 mice after subcutaneous injection of glu-OC. a, b, c, and d, p = 0.002, 0.040, 0.007, and 0.036, respectively, compared to WT+saline, Mann-Whitney rank sum test; *, p = 0.032 compared to cKO+saline, t-test. Sample size for each group is indicated at the bottom of the first three boxes from the left. J, Model for Cx43-mediated bone-muscle interaction. CC, circulation; F, muscle force; GJ, gap junction; HC, hemichannel; MF, muscle fiber; SC, satellite cell; SM, skeletal myoblast.

Comment in

References

    1. Wolff J. In: The Law of Bone Remodeling. Maquet P, Furlong R, translators. Berlin Heidelberg New York: Springer; 1986. (translation of the German 1892 edition)
    1. Shwartz Y, Blitz E, Zelzer E. One load to rule them all: mechanical control of the musculoskeletal system in development and aging. Differentiation. 2013;86:104–11. - PubMed
    1. Rolfe R, Roddy K, Murphy P. Mechanical regulation of skeletal development. Curr Osteoporos Rep. 2013;11:107–16. - PubMed
    1. Ward KA, Caulton JM, Adams JE, Mughal MZ. Perspective: cerebral palsy as a model of bone development in the absence of postnatal mechanical factors. J Musculoskelet Neuronal Interact. 2006;6:154–9. - PubMed
    1. Pearl ML, Edgerton BW, Kon DS, Darakjian AB, Kosco AE, Kazimiroff PB, et al. Comparison of arthroscopic findings with magnetic resonance imaging and arthrography in children with glenohumeral deformities secondary to brachial plexus birth palsy. J Bone Joint Surg Am. 2003;85-A:890–8. - PubMed

Publication types