. 2014 Dec 15;74(24):7357-70.
doi: 10.1158/0008-5472.CAN-14-0666. Epub 2014 Oct 27.

Homeoprotein Six2 promotes breast cancer metastasis via transcriptional and epigenetic control of E-cadherin expression

Affiliations

Homeoprotein Six2 promotes breast cancer metastasis via transcriptional and epigenetic control of E-cadherin expression

Chu-An Wang et al. Cancer Res. .

Abstract

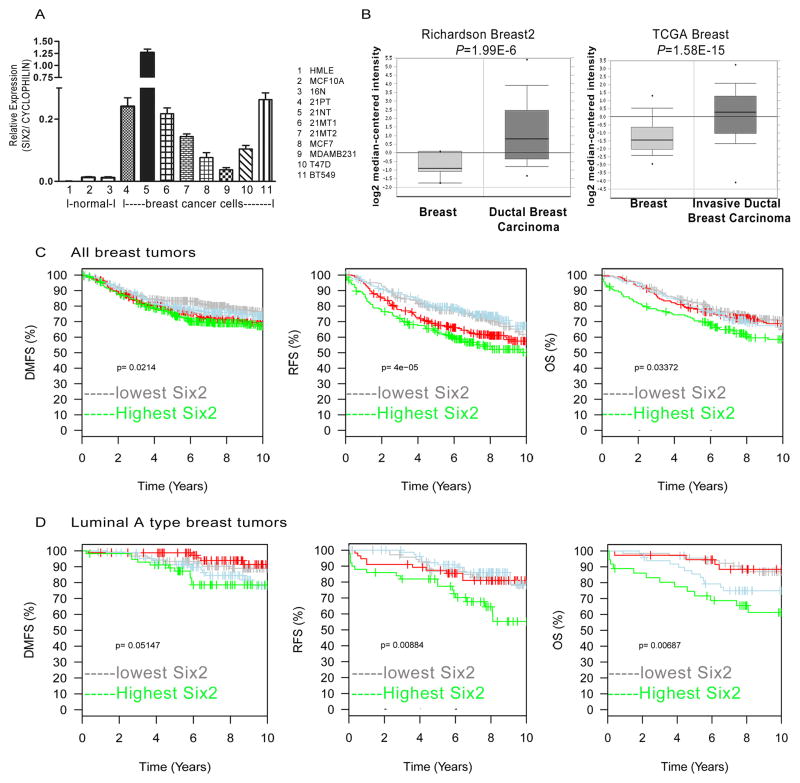
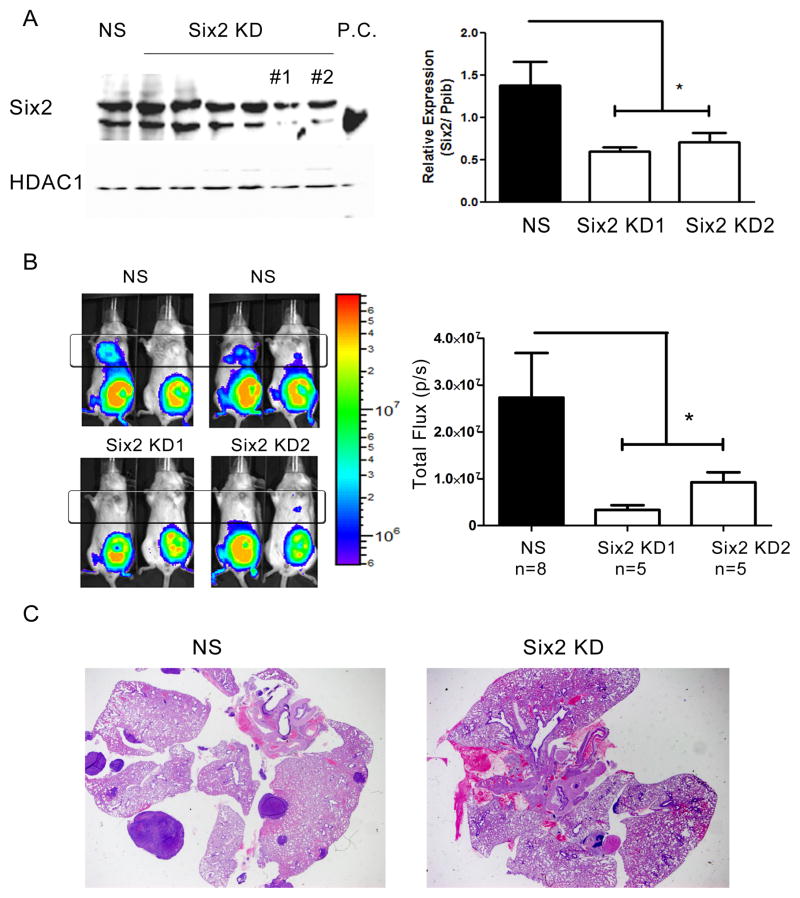
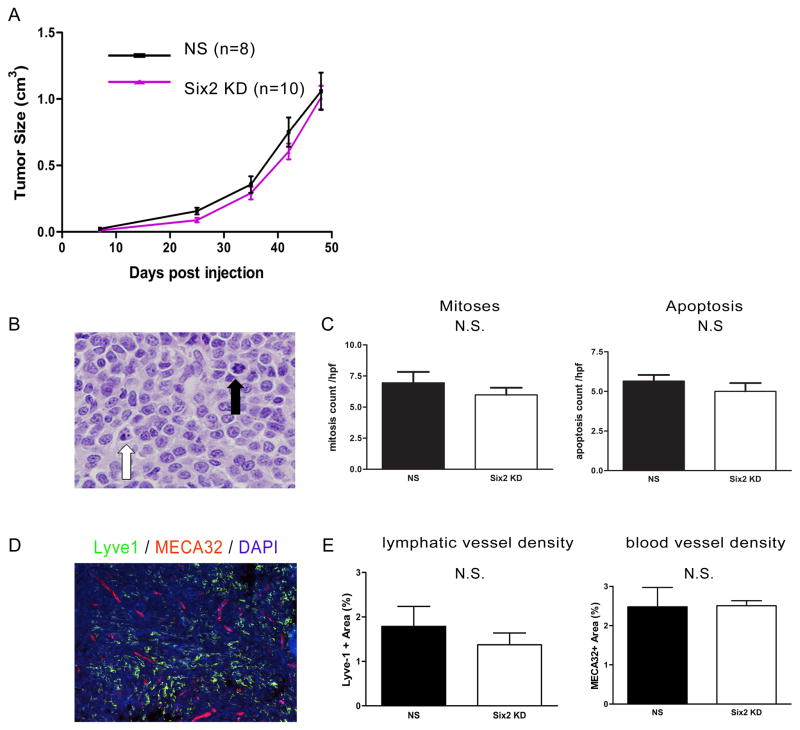
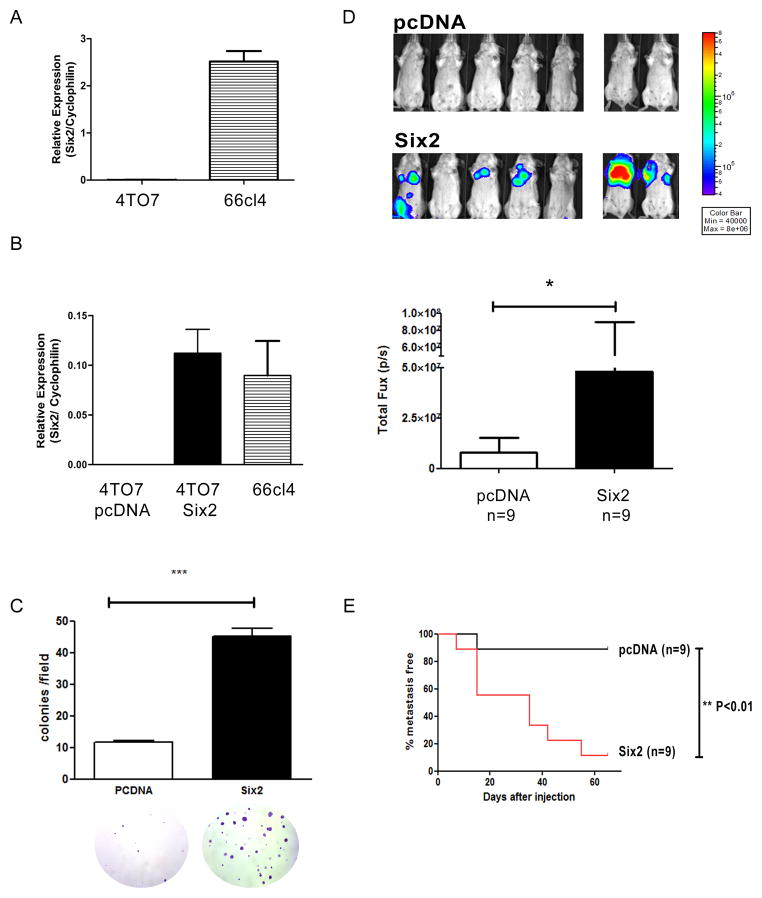
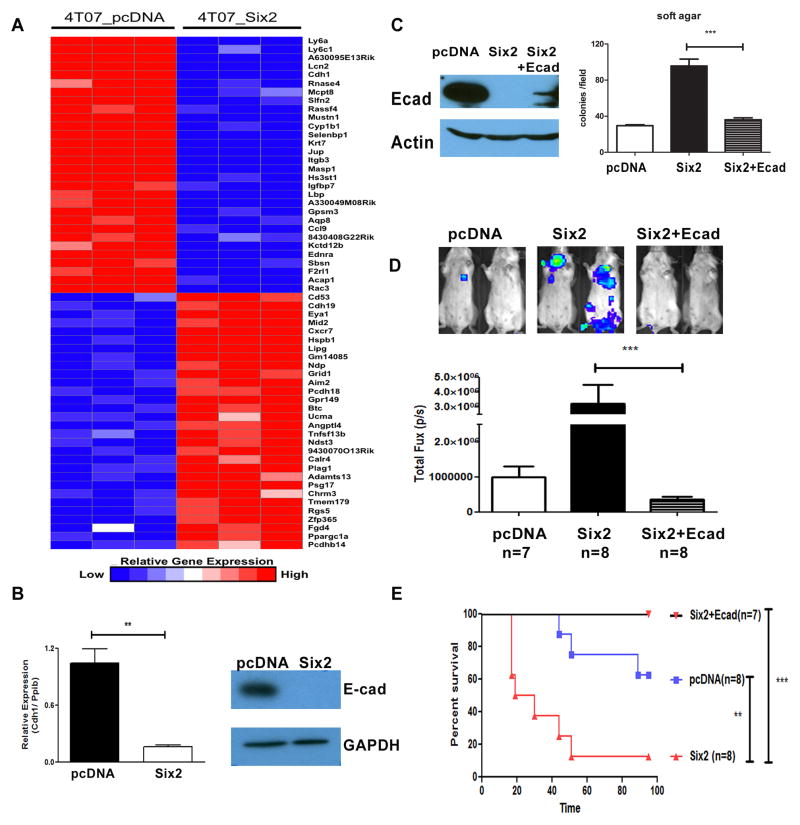
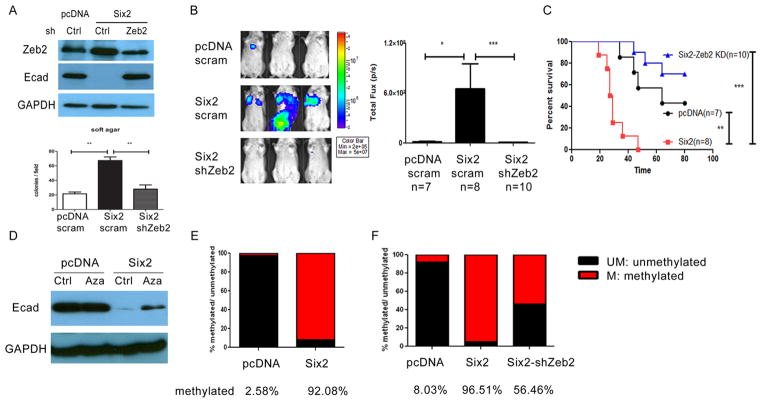
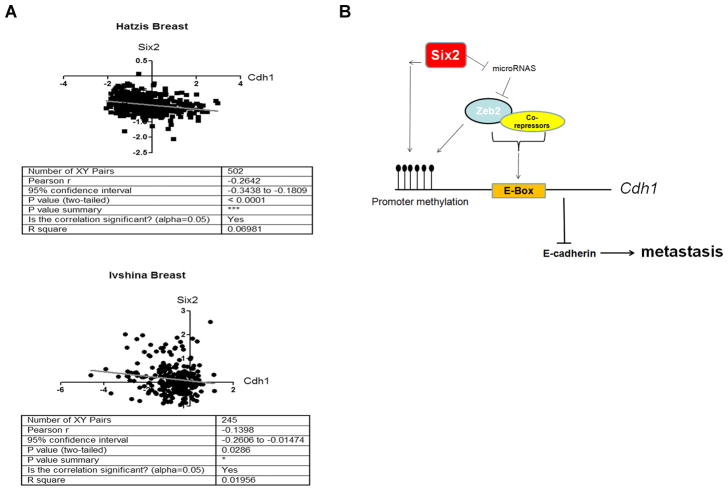
Misexpression of developmental transcription factors occurs often in human cancers, where embryonic programs may be reinstated in a context that promotes or sustains malignant development. In this study, we report the involvement of the kidney development transcription factor Six2 in the metastatic progression of human breast cancer. We found that Six2 promoted breast cancer metastasis by a novel mechanism involving both transcriptional and epigenetic regulation of E-cadherin. Downregulation of E-cadherin by Six2 was necessary for its ability to increase soft agar growth and in vivo metastasis in an immunocompetent mouse model of breast cancer. Mechanistic investigations showed that Six2 represses E-cadherin expression by upregulating Zeb2, in part, through a microRNA-mediated mechanism and by stimulating promoter methylation of the E-cadherin gene (Cdh1). Clinically, SIX2 expression correlated inversely with CDH1 expression in human breast cancer specimens, corroborating the disease relevance of their interaction. Our findings establish Six2 as a regulator of metastasis in human breast cancers and demonstrate an epigenetic function for SIX family transcription factors in metastatic progression through the regulation of E-cadherin.


Conflict of interest statement

Conflict of interest statement: H.L. Ford reports receiving a commercial research STTR grant from NIH 1R41CA180347 and a BDEG (Bioscience Discovery Evaluation grant). No potential conflicts of interest were disclosed by the other authors.

Figures

Fig 1
Fig 1. Increased expression of SIX2 in human breast cancers correlates with poor prognosis
(A) SIX2 mRNA expression was determined by real-time PCR and normalized to CYCLOPHILIN in three normal mammary epithelial cell lines and eight human breast cancer cell lines. (B) SIX2 mRNA expression in human breast cancers compared to normal breast tissue in Richardson breast2 and TCGA breast data sets from Oncomine. Oncomine (Compendia Bioscience, Ann Arbor, MI) was used for analysis and visualization. (C) Top quartile SIX2 expression predicts poor prognosis in human breast cancers. Kaplan-Meier curves show that SIX2 expression correlates with distant metastasis free (DMFS), relapse free survival (RFS), and overall survival (OS). (D) Top quartile SIX2 expression predicts poor prognosis in luminal A breast cancer. Kaplan-Meier curves demonstrate that SIX2 expression correlates with distant metastasis free survival (DMFS), relapse free survival (RFS) and overall survival (OS) in luminal A tumors by HU-gene expression subtype (45). Data was extracted from the GOBO website (http://co.bmc.lu.se/gobo).
Fig 2
Fig 2. Six2 KD decreases metastasis in the 66cl4 mammary carcinoma models
(A) 6 different shRNA against Six2 was used to knockdown Six2 in the 66cl4 cells and the most efficient Six2 knockdown cells (KD#1 and KD#2) were used for subsequent studies. Six2 expression was determined using Western blotting (left) and real-time PCR (right) in control (NS, non-silencing) and Six2 KD cells. P.C. stands for positive control, and demonstrates where the Six2 specific band runs. (B) Representative bioluminescent imaging of Balb/c mice injected with control (NS) or Six2 KD cells into the 4th mammary fat pad (left). Quantitation of distant luminescent signal, likely in lungs (boxed region) reveals a significant decrease in metastasis when Six2 is knocked down (right). (C) Histological confirmation of lung metastasis by H& E staining from control and Six2 KD.
Fig 3
Fig 3. Six2 KD does not affect primary tumor growth
(A) Primary tumor size in 66cl4 control (NS) injected mice and Six2 KD injected mice (two different shRNA lines were used and combined in the figure) tumors. Tumor size in the animals was measured using calipers, and calculated according to the formula V=1/2(W)(W)(L). (B) Representative histology showing cells undergoing apoptosis or mitosis. Black arrowhead: mitotic cell; white arrowhead: apoptotic cell. (C) Quantification of mitotic and apoptotic cells from 66cl4-NS and 66cl4-Six2 KD tumors. Mitotic and apoptotic cells were counted under ten high power fields per H&E section. Four control and five Six2 KD tumors were counted. (D) Representative picture showing lymphatic vessels using Lyve-1 staining and blood vessels using MECA-32 staining in a 66cl4 tumor. (E) Slidebook software was used to quantify lymphatic or blood vessels in four 66cl4-NS and four 66cl4-Six2 KD tumors. N.S. stands for no statistic significance.
Fig 4
Fig 4. Six2 expression promotes metastasis in the 4TO7 mammary carcinoma model
(A) Six2 mRNA expression was measured using real-time RT-PCR in 4TO7 and 66cl4 cell lines. (B) pcDNA control or Six2 expressing vectors were transfected into 4TO7 cells and clones were pooled after hygromycin selection. Six2 over-expression in 4TO7 cells was measured by real-time PCR to compare endogenous levels of Six2 in 66cl4 cells to those obtained with ectopic expression of Six2 in 4TO7 cells. (C) Six2 expression increases anchorage independent cell growth. Quantification of colonies formed in soft agar by 4TO7-pcDNA or 4TO7-Six2 cells (upper) and representative pictures of colonies in 4TO7-pcDNA and 4TO7-Six2 cells (bottom). (D) Luciferase labeled 4TO7-pcDNA or Six2 cells were injected into Balb/c mice through the tail vein and in vivo metastasis was measured using IVIS imaging. Representative pictures of animals injected with 4TO7-pcDNA or 4TO7-Six2 cells (top). Quantification of whole body luciferase per animal in 4TO7-pcDNA (n=9) and 4TO7-Six2 (n=9) groups (bottom). (E) Kaplan-Meier plot shows % of metastasis free mice in 4TO7-pcDNA control and 4TO7-Six2 expressing groups. Statistical analysis was performed using the log-rank test.
Fig 5
Fig 5. Restoration of E-Cadherin in 4TO7-Six2 cells suppresses Six2-mediated metastasis and increases survival in animals
(A) Gene expression using microarray analysis from 4TO7-pcDNA and 4TO7-Six2 was examined (each cell line microarray was performed in triplicate). Expression data is shown as top-regulated genes in 4TO7-pcDNA and 4TO7-Six2 cells. The color scale represents the expression level of a gene above (red) and below (blue) the mean expression level of that gene across all samples. (B) E-cadherin mRNA expression was determined by real-time PCR, normalized by Cyclophilin in 4TO7-pcDNA and 4TO7-Six2 cells (left). E-cadherin protein expression was measured by Western blotting. GAPDH was used as loading control (right). (C) E-cadherin expression in 4TO7-pcDNA, Six2, and Six2+Ecad was measured by Western blotting.β-actin was used as loading control (Left). Restoration of E-cadherin in 4TO7-Six2 expressing cells decreases anchorage independent cell growth (Right). Quantification of colony numbers formed by 4TO7-pcDNA, 4TO7-Six2, or 4TO7-Six2+Ecad cells. ***, P<0.001. (D) Luciferase labeled 4TO7-pcDNA, 4TO7-Six2, or 4TO7-Six2+Ecad cells were injected into Balb/c mice through the tail vein and in vivo metastasis was measured using IVIS imaging. Representative pictures from each group are shown (top) and quantification of luciferase signal in each animal injected with 4TO7-pcDNA (n=8), 4TO7-Six2 (n=8), or 4TO7-Six2+Ecad (n=7) is shown (bottom). (E) Kaplan-Meier plot shows overall survival of the injected mice. Statistical analysis was performed using the log-rank test.
Fig 6
Fig 6. Six2 represses E-cadherin expression via multiple mechanisms
(A) Zeb2 KD in 4TO7-Six2 cells reverses E-cadherin repression (Top). Expression of Zeb2 and E-cadherin in 4TO7-pcDNA, 4TO7-Six2 and 4TO7-Six2-Zeb2 KD cells was measured by Western blotting. shRNA targeting Zeb2 was delivered into 4TO7-Six2 cells and stable KD was selected using puromycin. Scramble shRNA was delivered into 4TO7-pcDNA and 4TO7-Six2 cells to serve as KD control. Zeb2 KD in 4TO7-Six2 expressing cells decreases anchorage independent cell growth (Lower). Quantification of colony numbers formed by 4TO7-pcDNA, 4TO7-Six2, 4TO7-Six2-Zeb2 KD cells in soft agar. **, P<0.01. (B) Luciferase labeled 4TO7-pcDNA, 4TO7-Six2 or 4TO7-Six2-Zeb2 KD cells were injected into Balb/c mice through the tail vein and in vivo metastasis was measured using IVIS imaging. Representative pictures (left) and quantification (right) of luciferase signal in animals injected with 4TO7-pcDNA (n=8), 4TO7-Six2 (n=8) or 4TO7-Six2-Zeb2 KD (n=7) cells are shown. (C) Kaplan-Meier plot shows overall survival of the injected mice. Statistical analysis was performed using the log-rank test. (D) Restored E-cadherin expression by treating 4TO7-Six2 cells with the DNA methylation inhibitor, 5Aza. 4TO7-pcDNA and Six2 cells were treated with DMSO (vehicle control) or 5Aza (10uM) for 48hrs and whole cell lysates were collected and Western blotting was performed for E-cadherin expression. (E) Six2 expression significantly increases E-cadherin promoter methylation. Genomic DNA from 4TO7-pcDNA and 4TO7-Six2 cells was collected and E-cadherin promoter CpG methylation status was detected using EpiTech Methyl II PCR primer assay (Qiagen) for the mouse Cdh1 promoter. (F) Zeb2 KD in 4TO7-Six2 cells decreases CpG methylation of the Cdh1 promoter. Relative amount of methylated and unmethylated E-cadherin promoter was detected using EpiTech Methyl II PCR primer assay for mouse Cdh1 in 4TO7-pcDNA, Six2, and Six2-Zeb2 KD cells. UM:un-methylated DNA. M: methylated DNA.
Fig 7
Fig 7. Six2 inversely correlates with E-cadherin expression in human breast cancers
(A) SIX2 and CDH1 expression values were retrieved from an Oncomine microarray data set (as indicated in the figure) and were plotted by expression value. Statistical analysis was performed using the Pearson’s test. (B) Model depicting the mechanism by which Six2 represses E-cadherin and promotes metastasis. Overexpression of Six2 in breast cancers leads to increased expression of Zeb2, at least in part through microRNA-mediated regulation. Increased expression of Zeb2 represses E-cadherin transcription by canonical E-box binding and also in part through DNA methylation. Six2 may also promote Cdh1 promoter methylation independent of Zeb2 expression. Decreased expression of E-cadherin by Six2 leads to increased metastasis and decreased survival.

References

    1. Christensen KL, Patrick AN, McCoy EL, Ford HL. The six family of homeobox genes in development and cancer. Adv Cancer Res. 2008;101:93–126. - PubMed
    1. Coletta RD, Christensen K, Reichenberger KJ, et al. The Six1 homeoprotein stimulates tumorigenesis by reactivation of cyclin A1. Proc Natl Acad Sci U S A. 2004;101:6478–83. - PMC - PubMed
    1. Micalizzi DS, Christensen KL, Jedlicka P, et al. The Six1 homeoprotein induces human mammary carcinoma cells to undergo epithelial-mesenchymal transition and metastasis in mice through increasing TGF-beta signaling. J Clin Invest. 2009;119:2678–90. - PMC - PubMed
    1. Wang CA, Jedlicka P, Patrick AN, et al. SIX1 induces lymphangiogenesis and metastasis via upregulation of VEGF-C in mouse models of breast cancer. J Clin Invest. 2012;122:1895–906. - PMC - PubMed
    1. Murphy AJ, Pierce J, de Caestecker C, et al. SIX2 and CITED1, markers of nephronic progenitor self-renewal, remain active in primitive elements of Wilms’ tumor. J Pediatr Surg. 2012;47:1239–49. - PMC - PubMed

Publication types

MeSH terms