

Effect of Genetic African Ancestry on eGFR and Kidney Disease
- PMID: 25349204
- PMCID: PMC4483587
- DOI: 10.1681/ASN.2014050474
Effect of Genetic African Ancestry on eGFR and Kidney Disease
Abstract
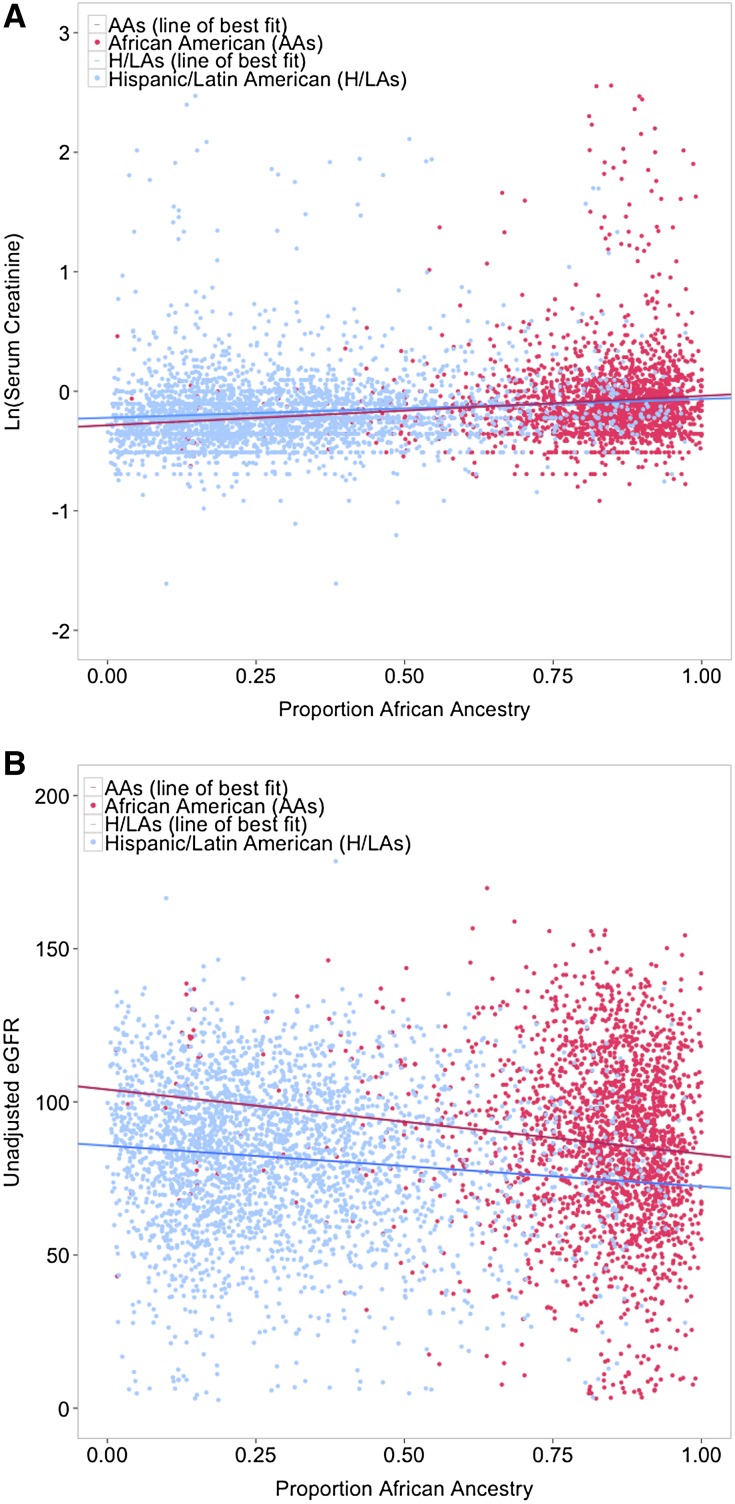
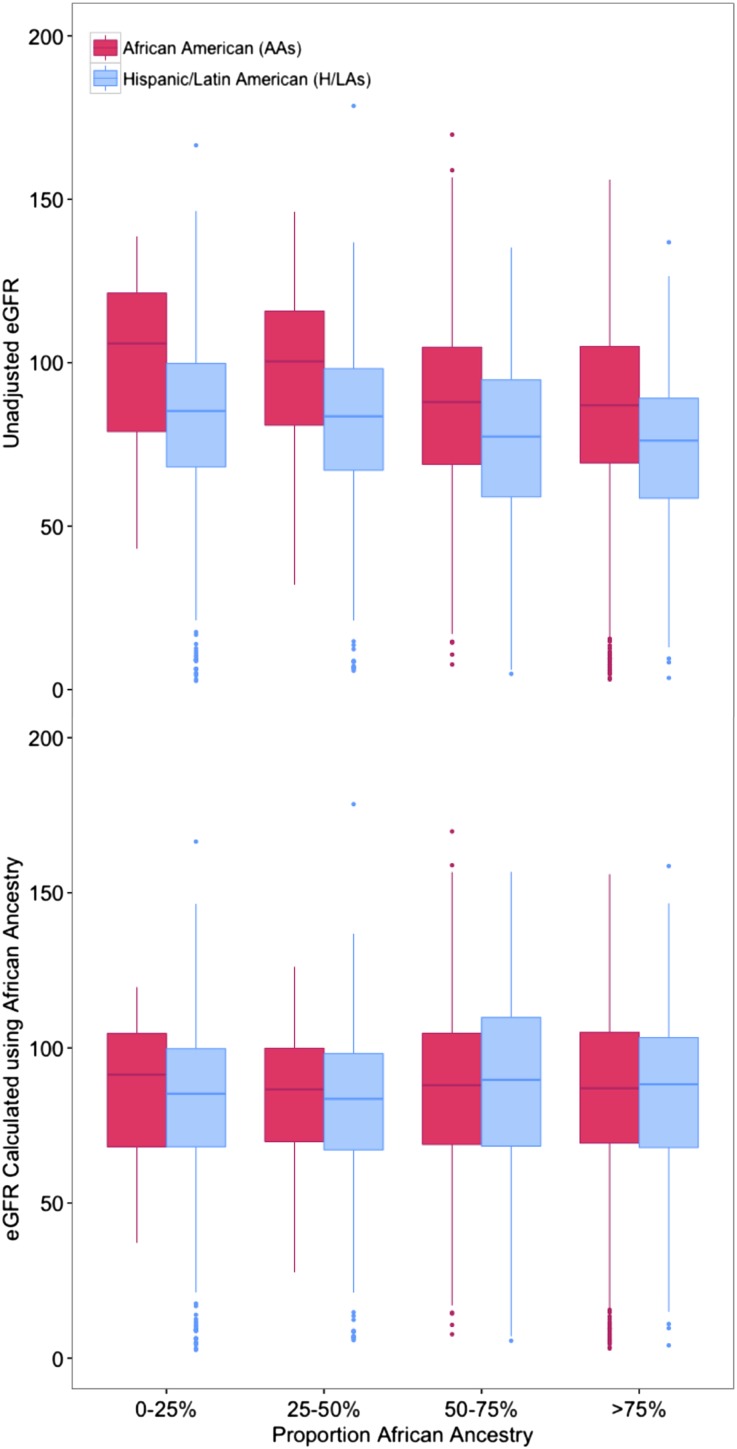
Self-reported ancestry, genetically determined ancestry, and APOL1 polymorphisms are associated with variation in kidney function and related disease risk, but the relative importance of these factors remains unclear. We estimated the global proportion of African ancestry for 9048 individuals at Mount Sinai Medical Center in Manhattan (3189 African Americans, 1721 European Americans, and 4138 Hispanic/Latino Americans by self-report) using genome-wide genotype data. CKD-EPI eGFR and genotypes of three APOL1 coding variants were available. In admixed African Americans and Hispanic/Latino Americans, serum creatinine values increased as African ancestry increased (per 10% increase in African ancestry, creatinine values increased 1% in African Americans and 0.9% in Hispanic/Latino Americans; P≤1x10(-7)). eGFR was likewise significantly associated with African genetic ancestry in both populations. In contrast, APOL1 risk haplotypes were significantly associated with CKD, eGFR<45 ml/min per 1.73 m(2), and ESRD, with effects increasing with worsening disease states and the contribution of genetic African ancestry decreasing in parallel. Using genetic ancestry in the eGFR equation to reclassify patients as black on the basis of ≥50% African ancestry resulted in higher eGFR for 14.7% of Hispanic/Latino Americans and lower eGFR for 4.1% of African Americans, affecting CKD staging in 4.3% and 1% of participants, respectively. Reclassified individuals had electrolyte values consistent with their newly assigned CKD stage. In summary, proportion of African ancestry was significantly associated with normal-range creatinine and eGFR, whereas APOL1 risk haplotypes drove the associations with CKD. Recalculation of eGFR on the basis of genetic ancestry affected CKD staging and warrants additional investigation.
Keywords: GFR; apolipoprotein L1; epidemiology and outcomes; ethnicity; genetic renal disease; renal function.
Copyright © 2015 by the American Society of Nephrology.
Figures
References
-
- United States Renal Data System: 2013 Annual Data Report, 2013. Available at: http://www.usrds.org/adr.aspx. Accessed May 14, 2014
-
- Gallagher D, Visser M, De Meersman RE, Sepulveda D, Baumgartner RN, Pierson RN, Harris T, Heymsfield SB: Appendicular skeletal muscle mass: Effects of age, gender, and ethnicity. J Appl Physiol (1985) 83: 229–239, 1997 - PubMed
-
- Stevens LA, Claybon MA, Schmid CH, Chen J, Horio M, Imai E, Nelson RG, Van Deventer M, Wang HY, Zuo L, Zhang YL, Levey AS: Evaluation of the Chronic Kidney Disease Epidemiology Collaboration equation for estimating the glomerular filtration rate in multiple ethnicities. Kidney Int 79: 555–562, 2011 - PMC - PubMed
-
- Genovese G, Friedman DJ, Ross MD, Lecordier L, Uzureau P, Freedman BI, Bowden DW, Langefeld CD, Oleksyk TK, Uscinski Knob AL, Bernhardy AJ, Hicks PJ, Nelson GW, Vanhollebeke B, Winkler CA, Kopp JB, Pays E, Pollak MR: Association of trypanolytic ApoL1 variants with kidney disease in African Americans. Science 329: 841–845, 2010 - PMC - PubMed
Publication types
MeSH terms
Substances
Grants and funding
- U01-HG006379/HG/NHGRI NIH HHS/United States
- U01 HG006375/HG/NHGRI NIH HHS/United States
- T32 DK007028/DK/NIDDK NIH HHS/United States
- U01-HG006375/HG/NHGRI NIH HHS/United States
- UH0HG006830/HG/NHGRI NIH HHS/United States
- U01 HG006389/HG/NHGRI NIH HHS/United States
- U01 HG006828/HG/NHGRI NIH HHS/United States
- U01-HG006382/HG/NHGRI NIH HHS/United States
- R01 DK097253/DK/NIDDK NIH HHS/United States
- T32 DK007757/DK/NIDDK NIH HHS/United States
- U01 HG006379/HG/NHGRI NIH HHS/United States
- U01 HG006830/HG/NHGRI NIH HHS/United States
- U01 HG006385/HG/NHGRI NIH HHS/United States
- U01-HG006380/HG/NHGRI NIH HHS/United States
- U01-HG006830/HG/NHGRI NIH HHS/United States
- U01-HG006389/HG/NHGRI NIH HHS/United States
- U01 HG006382/HG/NHGRI NIH HHS/United States
- U01-HG006385/HG/NHGRI NIH HHS/United States
- U01-HG006828/HG/NHGRI NIH HHS/United States
- U01 HG006380/HG/NHGRI NIH HHS/United States
- U01 HG006388/HG/NHGRI NIH HHS/United States
- U01-HG006378/HG/NHGRI NIH HHS/United States
- U01 HG006378/HG/NHGRI NIH HHS/United States
LinkOut - more resources
Full Text Sources
Other Literature Sources
Medical
Molecular Biology Databases
Research Materials
Miscellaneous
